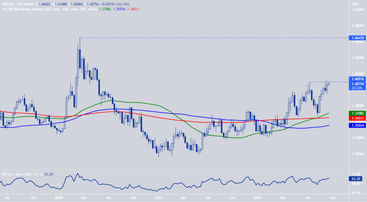
USD/SGD is slightly firmer in muted trade during the early Asian session on Tuesday as we count down to Wednesday’s FOMC.
The US dollar to Singapore dollar exchange rate is trading at 1.4070, +0.0010 (+0.07%).
Though the SGD has outperformed most Asian peers this year, it remains close to a two-year low against the greenback. Furthermore, the recent USD strength has seen the Sing dollar depreciate 3% in the last month, bringing the year-to-date loss to around 4.5%.
Despite SGD’s weakness, several investment banks are advising clients to gain exposure to the currency. Goldman Sachs, Citibank and MUFG have released bullish research notes, citing central bank policy as a reason to be long the Singapore dollar.
Analysts expect the Monetary Authority of Singapore (MAS) to tighten policy in the coming weeks. Unlike other central banks, rather than raise rates, the MAS employs currency intervention to effectively tighten the nominal exchange rate.
MUFG says there is a 50% chance the MAS will adjust policy next month, translating to a 1% gain for the Singapore dollar. Moreover, the bank is forecasting the US dollar to Singapore dollar exchange rate will end the year at 1.3800, around 2% below the current level.
Our call of a Singapore dollar rebound is premised on most of the Fed’s eventual rate hikes already being priced into markets now
Jeff Ng, currency strategist MUFG bank Singapore
While analysts are becoming friendly towards SGD, the technical outlook is less supportive. USD/SGD is testing a key resistance level. Which, if broken, could drive the Singapore dollar considerably lower in the near-term.
Check out our free comparison tool to find out the cheapest way to send money abroad.
Singapore Dollar Forecast
The weekly chart shows USD/SGD is testing horizontal resistance around the 1.4100 mark. The Sing dollar has spent the last three weeks nudging against the 1.4100 level, but is yet to close above it. A weekly close above 1.4100 is constructive for the US dollar, likely leading to more gains. In this event, a push towards the March 2020 high of 1.4647 is possible.
However, the longer the rate stays below resistance, the more chance it will retreat. In this scenario, support is seen between 1.3940 and 1.3989 (Sep 2019 and may 2022 highs). Whereas, a steeper decline targets the 50-Week Moving Average (WMA) at 1.3708 (green line).
USD/SGD Price Chart

Contributors


.svg)


