


.svg)


.jpg)


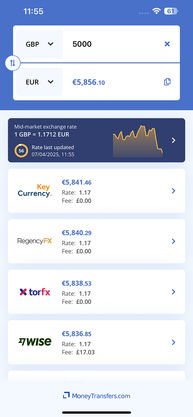
Convert on the go with our currency app
Convert 25,000+ currencies
Get reviews & insights
No ads or subscriptions
Compare live transfer deals


Convert 25,000+ currencies
Get reviews & insights
No ads or subscriptions
Compare live transfer deals
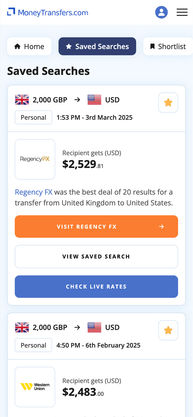
Save your favourite searches
Shortlist providers
Sync between all your devices
Absolutely free