Sending Money
Due to the booming money transfer industry, sending money online need not be complicated or expensive. Instead, there are plenty of straightforward and affordable options to choose from. That is, if you’ve done your research and find the right method of sending money for your needs: we can help you here. In our Sending Money guides, we will break down some of the best ways to transfer money, albeit online or in-person, as we provide an overview of the most recommended money transfer companies that can help you find the best deal for your money.
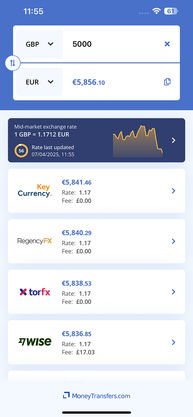
Search Now & Save On Your Transfer
How to send and receive money online?
Using money transfer services
Ideal for sending money internationally, money transfer services have made huge strides in the past couple of decades to make sending your money abroad cheaper, faster, and easier than ever.
With a number of transfer providers placing a huge focus on their digital presence, you can now access your account and initiate international transfers 24/7 from your mobile app, with the possibility to send or receive funds from the other side of the world within minutes.
Money transfer services work by users signing up to a free account, and then enter the details of the transfer. Most providers have a number of payment options such as bank transfer and card payments.
Using a trusted provider
Whether you’re paying bills abroad, supporting family members back home, or something else entirely, transfer providers like WorldRemit are one of the best ways of getting your money abroad cheaply, quickly, and securely.
What are the benefits of money transfer providers?
Money transfer providers are one of the most popular ways to send money online because:
They tend to have lower fees than traditional banks
They offer more competitive exchange rates
They can get your money to your recipient within a number of minutes in some cases
Many companies support transfers to hundreds of countries worldwide
Top money transfer providers
Person-to-Person apps and services
There are multiple services that will allow you to send money for free straight from your bank account to another person. Usually, these services or apps give you the option to link your bank account or you can pay by card (credit cards will usually have a small fee).
Top sending apps include:
PayPal: One of the most popular ways to send money online to friends and family as well as paying for online purchases and subscriptions, PayPal is one of the most well known payment services online. A bonus is that most other people will already have a PayPal account to save the hassle of setting up a new account when you need to get money to someone. When sending money domestically, most PayPal transfers are free.
Venmo: Available in the US only, Venmo is a free payment app that transfers funds from your bank account or debit card and can be sent using your recipient’s username, phone number, or email address. Venmo is popular with the younger generation particularly because it allows messaging with each payment.
Cash App: Cash App is another popular app for sending and receiving money online with no fee. To send money, you simply need your recipient’s username, phone number, or to scan their Qr code. Cash App is only available in the US and UK.
Zelle: Zelle is a US peer-to-peer service for bank transfers, offering fast and free bank transfers to customers whose banks are partnered with the service. To sign up, you need to register directly on Zelle via the app, and you can then send money directly from your bank account to your recipient.
What are the benefits of person-to-person sending apps?
For small, domestic payments between friends and family, the apps listed above are some of the most efficient ways of getting your money to someone quickly and cheaply. The one caveat is that often both parties will need to have an account for the app you are using.
Banks
Of course, another option for sending your money online is to use your bank. If you are looking for a straightforward bank to bank transfer, using your bank’s online app can be a convenient way to do this.
What are the benefits of sending money online with your bank?
Sending money online with your bank can be a convenient way of getting your funds to your recipient as you don’t need to sign up to a new account with a third party provider. However, banks also tend to have the highest fees associated with money transfers (particularly international transfers), and slower transfer times.
Top banks to send money abroad
How can I send money online instantly?
It’s important to know that not all online money transfers will be processed instantly, so if you need to get your money to someone urgently, you should first make sure the service you are using can facilitate this. A number of things can affect how quickly your transfer is processed, including:
Where you are located
Where you are sending funds to
What payment method you select (bank transfer can sometimes take longer than a card payment, for example)
How you choose for your recipient to receive the funds (cash pick ups are often available very quickly)
Our guide to sending money instantly covers some of the top services to use for rapid transfers anywhere around the world.
Sending money online with a debit card
Paying by debit card to send money online is a popular choice for many people looking to transfer money. Essentially an extension of your bank account, paying by debit card is a widely accepted payment method and means the funds will leave your account near instantly, which means you’re not borrowing money to send a transfer.
However, keep in mind that sending money via debit card can incur higher international transfer fees than some other means. Our full guide to sending money with your debit card will take you through the pros and cons in more detail.
How do I transfer money to someone else's bank account?
The steps to transfer money to someone may vary slightly depending on what method you use to send money online. However, generally speaking, the process will be relatively similar and straightforward:
Choose your provider
Create your account
Enter the details of your transfer
Double-check the charges
Start your transfer
What details do you need to transfer money online?
Although your provider will no doubt guide you through the process of sending your money online, it's helpful to have all the details you'll need prepared ahead of time. For sending money online, you will usually need the following details of the person or organisation you are sending to:
The name of the person (or organisation) you are paying
The bank account number of the account you are paying into
The sort code of the account
The date you want the payment made
The sum you are sending
If sending internationally, what currency you need it converted into
A payment reference so the payee knows where the money came from
Occasionally, the name and address of the bank you are sending to
In some cases, the IBAN/BIC codes of the account you are paying into
In addition, you'll need to provide some details about yourself. This typically includes:
A valid form of ID such as a passport or driving license to verify your identity (may not always be required)
If paying by bank transfer, your full name as it appears on the account, bank account number, and sort code/BIC/SWIFT code
If paying by card, the long 16 digit number on the front of your card, the expiry date, and CVV security code
Read our guide on sending large sums of money internationally for more information on the documents you may need if sending a larger amount abroad.
Other payment methods for sending money online
Sending money via bank transfer can be a convenient way of electronically transferring funds between two bank accounts, but it’s not always the quickest way to get your money into your recipient’s hands.
Other ways you can have your payment delivered to your recipient include:
Cash pickups or delivery
Cash is one of the fastest ways to get your money to your recipient. Not all money transfer providers offer this service, so make sure it’s available before locking in your transfer. A few of our top recommended providers that do offer cash payouts include WorldRemit and Ria Money Transfer.
Mobile wallets
Many money transfer providers have a large digital focus with user-friendly apps to make managing your transfers accessible 24/7. One popular payout option is to send your funds to a mobile wallet, which your recipient can access if they also have an account with the provider you are using.
Mobile top ups and other app transfers
Some money transfer providers even offer the option to send money in the form of a mobile top up. This can be helpful if, for example, you are sending money back home to family and paying for their mobile so you can stay in regular contact is part of why you are sending money home.
Money orders
How much money can I send abroad?
How much does it cost to send money online?
What is the best way to send money online?
The best way to send money online will vary depending on the circumstances of your transfer. Different providers will be more suitable if you are sending money domestically compared to if you are looking to send money abroad, for example.
A few of our top recommendations include:
✓ Best for international transfers to friends and family
When sending money abroad, a money transfer provider is almost always the cheapest and most efficient way to get your money securely to your recipient’s bank account - without losing a large percentage of the transfer amount to transaction fees.
TransferGo, for example, has a fixed free structure that is clearly displayed when you enter the details of your transfer, with a range of options that allows you to prioritise cost or speed. One of their biggest advantages is the company's 30 minute transfer option when sending money from the UK, with the option for weekend transfers.
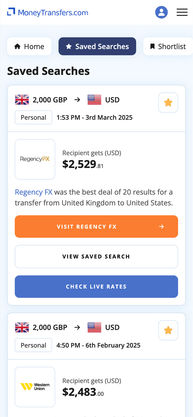
Ultimately, the best money transfer provider for your international transfer will depend on the circumstances of your transfer. That is, where you are located, where you are sending money to, the sum you are sending, and the payment and payout methods that best suit you and your recipient. We always recommend using our innovative comparison engine to find the best option for you.
✓ Best for domestic transfers to friends and family
For sending smaller amounts to friends and family, a peer-to-peer app will often be the most affordable and faster way to get your money to the receiving account. Popular apps well-known for their user-friendly interface and free transfers include:
PayPal
Venmo (US only)
Cash App (US only)
✓ Best for sending large sums
Not all third-party providers are suitable for sending large sums, for example, if you need to transfer a deposit for buying a home abroad. This is because many providers have a maximum sending limit, whilst others require further verification of your identity before they can process your payment.
We would recommend using our comparison tool to help you find a suitable provider for the amount you are looking to send.
Looking for domestic money transfers?
FAQs
How much does it cost to send money online?
How long does it take to send money online?
What is the safest way to send money online?
Bottom line
Sending money online is more accessible than ever nowadays, with apps and online banking making it possible to access your accounts and move your money around the world within minutes. While sending money may be easier than ever, however, it also pays off to be informed about what to look for in a transfer provider to ensure you're getting the best deal in terms of cost, speed, security, and reliability.
The best way to do that? Research the best provider for your specific transfer needs. Specialist transfer providers will all have their own fee structure, exchange rate markup, and transfer time capabilities depending on the two countries you are sending between. Comparing services is the most efficient way to ensure you're matched with the best option for you.
Looking for more information?
Below we've compiled a list of top news and guides for you to read. If you want to know more about the industry, be updated with recent changes to expatriate and travel laws, changes to regulations or anything else, check out some of our top guides:
Related Content


Contributors