International Bank Transfers
We only list companies that are trustworthy and appropriately licensed. Our aim is to give you a comprehensive view of the regulated money transfer marketplace.
DisclosureMoneyTransfers aims to help users find the best money transfer provider for their needs. To support our free service, we may earn a commission from some of the providers listed in our search results. The commission may also impact the ordering of the providers shown. Our reviews are independent from this and are based on our editorial policy, research and testing of dozens of remittance providers on the market.
A bank transfer is a way of moving money from one bank account to another, be it your own or someone else's. It's also a simple, convenient, and popular way of sending money abroad.
However, most banks will charge hefty fees for international (and some domestic) transfers.
Here, we have a collection of guides we've put together to help you save on transfers abroad. We'll also explore the bank fees, transfer speed, your options, and better alternatives.

Best Bank Accounts for Digital Nomads
The digital nomad or expat lifestyle is very appealing, but can often mean a rough deal when banking.

International Bank Transfer Fees
International wire transfer fees in the US can range between $25 and $45, depending on the bank, while some banks also charge different fees for outgoing and incoming wire transfers. MoneyTransfers.com has looked at the biggest banks in the US, the UK and around the world to see how much they charge for international wire transfers:

Sending Money Abroad
Ideal for sending money internationally, money transfer services have made huge strides in the past couple of decades to make sending your money abroad cheaper, faster, and easier than ever.
Send money using bank transfers
Revealing Online Banking Statistics & Facts
Best Bank Accounts for Digital Nomads
Best Online Banks in the UK
Bank Transfer Vs Wire Transfer
How to Send Money With a Credit Card: All Your Options Compared
Different Ways to Send Money to a Bank Account in 2026

How to send money to someone without a bank account
How to Open a Bank Account Overseas

Best Multi-Currency Accounts
What is a Building Society Roll Number?
What Are Routing Numbers And How Do You Find Them?
What is a Transit Number?
What Are Virtual Bank Accounts?
What is a bank code?
Telegraphic Transfers
SEPA Transfers
International Bank Transfer Fees
Email Money Transfer
Guide to Electronic Funds Transfers
What is a BSB Number?
What is a BACS payment?
Table of Contents
Table of Contents
Bank transfers explained
A bank transfer is a way to move money from one bank account to another bank account.
This can be moving money between your accounts, sending money abroad, or paying friends and family.
It's like when you give someone cash, but instead of handing them bills and coins, the bank moves the money for you electronically.
Here’s a simple example, say you want to pay someone in the UK but you’re located in the US.
You give the bank instructions: You tell your bank how much money to send and the details of the account you want to send it to.
The bank processes the transfer: Your bank takes the money out of your account and sends it to the other bank.
The other bank receives the money: The other bank puts the money into the recipient's account.
But here’s the catch
Before the bank can process the transfer, you need to pay the fees.
The fees will depend on multiple factors such as the amount and the location of the recipient.
In addition to the transfer fee, you will also pay the exchange rate margin (percentage added to the mid-market rate).
Are bank transfers the same as wire transfers?
Although both terms are used interchangeably, there’s a slight difference between the two.
The difference is in the way the transfers are processed.
Bank transfers will usually process the transactions via ACH (Automated Clearing House), while wire transfers will use the SWIFT network for transfers.
The key differences between the two lie in their function, speed, cost, and geographical reach.
Here’s a quick breakdown of the two:
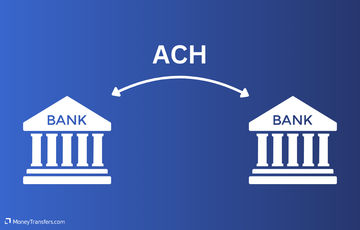
ACH transfers
ACH is a network used for electronic money transfers, used within the same country (usually the US).
It’s generally slower (2-3 days) than SWIFT but comes with lower fees. Hence, it is used largely for routine transactions such as direct deposits, bill payments, and transfers between accounts.
SWIFT payments
SWIFT on the other hand is a global messaging system that connects the banks for international transfers.
It is faster compared to ACH (minutes-2 days) but comes with higher fees (for both, the sender and the receiver).
SWIFT is usually used for international money transfers, making large payments, and urgent transfers.
Making international bank transfers
Here’s a quick overview of how to initiate a bank transfer when sending money to another country.

Get the recipient's details
You need the recipient's full name, bank account number, the name and address of their bank, and the SWIFT/BIC code of their bank. These details ensure the money goes to the right place.

Vist your bank or use online banking
Go to your bank or use their online banking service. Tell them you want to make an international transfer.

Provide the details
Give your bank all the recipient’s details mentioned earlier, along with the amount you want to send and any reference information.

Confirm and pay
Your bank will confirm everything with you, including any fees for the transfer. Once you agree, they’ll deduct the money from your account.

Wait for processing
International transfers can take a few business days to reach the recipient's account, depending on the countries and banks involved.
Check confirmation
After a few days, you can check with your bank or the recipient to make sure the money arrives safely.
Opening a bank account
Chances are, you already have a bank account. But if not, you will need to create one.
To open a bank account, simply navigate to the bank's website and sign up.
During the application process, you will need to provide your personal details, as well as an ID.
The process is slightly different if you’re opening an account overseas.
Details needed for international bank transfers
To make an international bank transfer, you’ll need your recipient’s:
Recipient's full name: The exact name associated with the recipient's bank account to ensure the transfer reaches the correct person or entity.
Recipient's bank account number: The unique account number where the money will be deposited. This is crucial to ensure the funds go to the intended recipient.
Recipient bank's name and address: The name of the bank where the recipient holds the account and its physical address. This helps in identifying the correct financial institution.
Recipient bank details: often you will need the recipient bank's routing number (for US transfers) or SWIFT/BIC Code (for international transfers).
Amount to transfer: The exact amount of money you wish to send. Double-check this to ensure accuracy.
Reference or memo (optional): A note or reference number that can help identify the purpose of the transfer. This is particularly useful for personal records or when providing information to the recipient.
Make sure you double-check these details, as it might be difficult to reverse your transfer if some of the details are incorrect.
For example, if you're sending money to Norway, you need to provide the correct Norwegian SWIFT code for the recipient's bank located in Norway.
Use our SWIFT/BIC calculator below to get these details
Banks vs money transfer services fees
You have two main options when making an international bank transfer: using your bank or using the services of a money transfer provider.
Using your bank to make an international transfer may seem like a convenient way to send your money abroad, but it often ends up being one of the most expensive methods.
This is because banks tend to add several fees to international transfers, including:

Upfront international banks' transfer fees
A bank transfer fee is added to your transfer at the time of setting up the transfer and usually varies from bank to bank
SWIFT network fees
These are the fees that add up while the transfer is in progress (usually charged by the intermediaries). This charge can apply to the sender or the receiver depending on the service you use. This fee is not involved when using most money transfer services (as there are no intermediaries involved).
A markup on the exchange rate
On average, banks add between 4-5% on top of the ‘real’ exchange rate. This fee is very difficult to see if you’re using the bank. Money transfer companies, on the other hand, will usually display it before making the transfer.
*A markup on the exchange rate is charged by almost all banks.
For that reason, it is important to always check the exchange rates before making your international money transfer.
Consider this before making bank transfers
Before making an international bank transfer, you need to consider the following:
Fees
Check if there are fees for sending the money. Banks and services may charge different amounts, so it’s good to know upfront.
Make sure to .
Exchange rates
Understand how much money you'll get in the recipient's currency. Exchange rates can vary, affecting how much your recipient receives.
Many banks will add 4-5% to the actual, ‘real’ exchange rate.
Again, to get the best exchange rate.
Speed
Some transfers can be quick, while others may take a few days. If it's urgent, ask about the transfer speed.
Usually, money transfer services will offer almost instant transfers, while banks can have delays.
Recipient details
Make sure you have the correct information—like their full name, bank account number, and bank's name and address—to ensure the money goes to the right place.
Security
Use trusted methods and double-check details to avoid mistakes or money transfer scams.
Regulations
Be aware of any rules or limits for international transfers that could affect how much you can send or receive.
Country restrictions
Some countries have specific regulations or restrictions on incoming or outgoing transfers.
Ensure your transfer complies with these rules to avoid complications.
Currency support
Confirm that your bank or transfer service supports the currency you need to send.
Not all currencies may be available for international transfers by every service.
Our comparison tool will suggest the best providers based on your transfer route.
Documentation
Depending on the purpose of your transfer (e.g., business payments, or personal remittances), you may need to provide additional documentation or information to comply with legal or regulatory requirements.
Use of funds
Be aware that some transfers may be subject to scrutiny to prevent money laundering or other illegal activities.
Ensure you can explain the purpose of your transfer if asked.
Here’s a fun fact, I sent £10,000 to Revolut a few years back, and it got flagged, so I had to verify my transfer and submit the proof of funds.
Bank requirements
Different banks may have varying requirements for international transfers.
Some may require additional verification steps or documentation based on the amount being transferred or the destination country.
Transaction limits
Be aware of any transaction limits imposed by your bank, especially for larger transfers.
You may need to request special authorization for high-value transactions.
Pros and cons of using bank transfers
Using bank transfers has its pros and cons compared to other payment methods.
- Security: Bank transfers are generally considered secure because they involve direct transactions between banks, minimizing the risk of theft or fraud compared to carrying cash.
- Convenience: It’s convenient because you can initiate transfers online or through your bank’s mobile app without needing to visit a physical location.
- Direct deposit: Bank transfers are ideal for direct deposits of salaries, benefits, or recurring payments like rent or utilities.
- Wide acceptance: Widely accepted for various transactions, including large payments and international transfers.
- Speed: Bank transfers can be slower than other methods like credit/debit cards or digital wallets. Domestic transfers can take a few days, while international transfers may take longer.
- Fees: Some banks charge fees for transfers, especially for international transactions. These fees can vary widely depending on the banks involved and the transfer amount.
- Information required: You need detailed information about the recipient’s bank account, which can be cumbersome and prone to human errors if not entered correctly.
- Regulations: International transfers may be subject to regulatory scrutiny, requiring additional documentation or information depending on the countries involved.
Best services for international bank transfers

Wise
Wise offers no exchange rate markup and low fees on top of your transfer, usually 0.35%. This is low compared to some banks that charge almost 17% in fees.
They offer 70 currencies, and where they don’t support the currency, you will need to pay an additional 2% fee to receive.
With Wise you can deposit your funds using a bank transfer and the receiver will get their money right to their bank account.
Please share your experience with Wise
Would you recommend Wise?
Russell Pinkes
I can’t send money to Belize
Katsiaryna
Once trying to open sire, was automatically blocked for no reason
Alan
Unable to transfer money from Philippines to any other country. Philippines Wise does not work
Anonymous
Retiro de dinero en transferencia
Uwe
great rates and service - unfortunately for some countries not yet available
Martin Premprakash Anantharaman
On the first transfer to a hospital in NY they were already screaming that this was a sure scam and the same on my next transfer to a fried in Nigeria. They then summarily closed my account TERMINATING THE RUNNING TRANSFER TO NIGERIA, claiming that, hold on, I was being scammed🤦♂️ Sure, I could have appealed but immediately found that I would have had to provide so much intrusive detail that I desisted.
Martin Premprakash Anantharaman
Setting up is a bit unwieldy if you want to make a one-off transfer, as you have to create an account with complete identification - but it works and the process as well as charges are great.
Anonymous
My brother wants to send me money from India to Nigeria but he's finding it difficult how can he do it
Mohammed
WARNING : Wise was Great until main office decided to ruin WISE By letting the TW India office control handling Random verifications and do what ever they want by insane replies and no replies etc. If you want to waste your time and enjoy a journey into Black Hole of Insane then go ahead and try WISE !
Anonymous
Can't receive money from php to idr so far
sudheir
They don't allow transfer to Brokerage firms from India
Anonymous
Good app to transfer money
Anonymous
I didn't find Cuba on your list.
Anonymous
cuba not work
Nina
I made a transfer to a Canadian company 1.5 months ago, and the funds have not yet been received. After multiple emails, Wise insists that the money was paid out. However, I have received an official statement from the recipient’s bank confirming that the money has not been received. Wise's complaints department sent me a final letter stating that, according to their records, the funds were paid out. Additionally, Wise states the following in their Customer Agreement regarding their responsibility for losses: Quote from Wise's Terms: "Our Customer Agreement also explains our responsibility for losses in Section 29: 29.1 Unforeseeable loss or damage. We are not responsible for any loss or damage that is not foreseeable. Loss or damage is foreseeable if either it is obvious that it will happen or if, at the time the contract was made, both we and you knew it might happen, for example, if you discussed it with us during your sign-up process. 29.9 We are not liable for things which are outside of our control. We (and our affiliates) cannot be liable for our inability to deliver or delay because of things which are outside our control." Despite these terms, Wise has not been able to resolve this issue, and the money has still not been delivered as promised. I find it irresponsible that Wise does not conduct any investigations into the matter. The Canadian bank associated with Wise is unable to provide any information, as everything goes through Wise. Wise must be capable of tracking the funds and providing precise details about where exactly the money is, who received it, and to which bank account it was deposited. I would advise everyone to be cautious when transferring large sums of money with Wise. They are not capable of executing a secure money transfer!
Shengjie Yin
good and perfect
Tristan
Beware: Wise's Unethical Policies and Unresponsive Support Cost My Business I am sharing my experience with Wise to warn fellow business owners about the serious risks and unacceptable practices you may encounter if you choose to use their services. My business, is a legally registered travel agency in the UK, and I relied on Wise to manage payments for my photography and cultural tours, primarily in South America. Things took a turn for the worse when Wise froze my account and accused my business of violating their Acceptable Use Policy, citing my once-a-year humanitarian trip to Cuba. Despite explaining multiple times that: No Cuba-related transactions were ever processed through Wise (I use a separate European bank for this purpose), My tours comply with the “Support for Cuban People” category authorized by OFAC, designed to help Cuban citizens outside state control, Wise completely ignored the facts. Their customer support team responded with automated messages, refused to engage in any meaningful dialogue, and even lied, claiming they didn't monitor my emails—despite clear evidence to the contrary. After days of chasing them and providing thorough documentation, they chose to close my account without justification. The Consequences: Wise left my business in chaos, disrupting essential transactions and client arrangements. Their rigid policies align with sanctions widely condemned by the global community, and in doing so, they indirectly support humanitarian suffering. The Bottom Line: Wise is unreliable, unresponsive, and unethical. If your business has any complexity or humanitarian focus, beware: Wise will shut you down without notice or explanation, and customer support will abandon you. Their actions have serious real-world consequences. Avoid Wise if you value your business stability or require ethical and accountable financial services. There are far better alternatives out there that won’t put your livelihood at risk Beware: Wise's Unethical Policies and Unresponsive Support Cost My Business
Anonymous
I have been a customer for a few years. Yes I love the instant deposits as I make around $1K. However as many non US entities Wise uses a bank out of New York. Therefore the TRANSFER and DEPOSIT from an account transfer can take 4 to 6 days. What this means is that you will not able to make another ACH transfer during this time. This is frustrating if you have to make a follow up transfer in a few days. All in all don't plan to make more than 4 transfer in a month because it may not fo through, Not sure if other transfer companies operate the same way but I am about to find out as I will try Revolute. Bottom linw will require you to use ANOTHER payment method like credit card or some other method. Understand this: YOU MAY HAVE THE MONEY IN YOUR ACCOUNT but they WILL NOT TRY TO VERIFY IT WITHIN THE THE PERIOD IT WILL TAKE THEM TO DEPOSIT IT IN YOUR ACCOUNT. To add insult to injury I called in and the agent siad that they can see that they got paid but the computer takes time to update/reconcille I guess! It is a slow system!
Anonymous
There is a lot of advice on RECEIVING INHERITANCE in the UK from overseas but nothing on the rules for SENDING money gifts to grandchildren living OVERSEAS and the rules on Inheritance Tax in that case.
Anonymous
The service is decent, nothing more. I have had security issues that are not quickly resolved. Call center personnel are average. The app is not, in general, user friendly. You should definitely do research on a variety of service providers before making a choice. Do not take the reviews at face value. I chose Wise based on positive reviews but now regret not doing more research on other companies.
Anonymous
So far so good
Daniel
I checked to see if Wise even sends money to Colombia. Colombia is not even in their list of countries. Why is it even advertising for Colombia?
Bill Sanders
I have used Wise for several years. They once rejected a large transfer because it was to a coal company. Apparently, they are a woke company! But they refused to tell me why. More recently, they required verification of my identity using a smart phone. I am 69 and never owned a cell phone because I don't need one. But they forced me to buy one, which I did last week. Getting the phone updates ate up all my data, so i got 1 GB more. I took 12 different pics of my passport and another 12 of my face for them. They rejected them - and are holding up my transfer. Now my phone ate up that gig of data and I must buy another gig (thru Tracfone) just to use the phone. What a hassle. This is not a photo studio! They know who i am already. Note: This comment has been edited by the MoneyTransfers.com team to align with our content guidelines.
Ziggy Meilus
It used to be always instant, now it may come right away or it can take 5 even 7 days to get the money.
Anonymous
i've heard of people having issues with accounts being locked/restricted, but i think that was mostly for business accounts, maybe they were locked for good reason. for me, i've had no issue with my account though i've only used it for small transfers and not very often, over the past 5+ years
Here's our experience with Wise

WorldRemit
WorldRemit boasts a 90% approval rate on international transfers being authorized within minutes and supports 70 currencies in 130 countries worldwide.
The service has a user-friendly app and website and supports sending money internationally via bank transfer, cash pickup, mobile money, and to WorldRemit e-Wallets.
As an example, if we were to send £1,000 to Australia, converting to Australian dollars, the bank transfer would take a maximum of 2 working days with a fee of £1.99, and a total of A$1827.39 received.
Please share your experience with WorldRemit
Would you recommend WorldRemit?
Andrew Judd
My account was deactivated. No reason given. I don’t have multiple accounts. One recipient was a scammer and I deleted them. I’ve helped out many friends with medical expenses. Wisdom tooth extracted 2500 and 1000 for some food. That’s all Motorcycle accident 5000 that’s all Flight home and medicine for grandfather 6000 That’s all. The scammer offered a video. I don’t buy any videos I’m visiting a friend who is a teacher and offered to pay 2600 for a flight and 16000 for luggage, swimsuit and rent on her place while she is off work and holidaying. Now I have to go to a post office and use western union
Terry Twala
Very efficient.
Anonymous
Very misleading, live exchange rate does not match with their app is showing. Fast and seems to be secure, I use them when I'm in need to send fund ASAP.
Anonymous
different price from shown here
Anonymous
exchange rates on comparison website are quite high
Anonymous
Only phone app.
Stanley Davidson
After setting up a valid account with all true and real identity, the system blocked me without any valid reason. Upon calling Customer Service & requesting a reconsideration & a valid reason why I was blocked, Customer Service said that I "violated some TOUs" (Terms Of Use) without stating exactly what I did. My ONLY action was an ATTEMPT to do a normal wire transfer. One can't do anything but to do a wire transfer, & it WAS NOT completed. How do they block my account for something, whatever it was, that I supposedly committed? When I requested the reason for the block they'd said that "it's Company policy to not provide reason(s) why an account is blocked", so exactly how am I supposed to not do something if I re-read their Policy against such action when I can't find why I was blocked? It was asked repeatedly why/what Policy(ices) was/were broken enough to cause the account to be blocked, but they'd completely refused to answer or acknowledge the question, they'd just kept completely silent. That ended the conversation because anything further would remain in total silence, so it was useless to ask anymore questions. I will be 💯% posting this exact statement on www.trustpilot.com for the world to see how undeserving this company is when mistreating a customer for no valid reason. Please enjoy the review!!!
Anonymous
Awesome service
Anonymous
I cannot figure out how to fund my transfer with my bank account instead of a debit card. The Chat service took way to long to answer my questions. Frustrating experience.
Robert Myles
Hi All a good place to send money to ghana
Jake Reynolds
Is this company an app? Or does it run a proper website? Who knows? Customer service is only through their app so I am guessing that if you dont do 100% of your transactions through your phone, forget WorldRemit. I dont use my phone because after all the extra strong passwords, and bio id, and 2 step verify, and whatever comes next they are STILL UNSECURE.
Anonymous
The money I sent got stuck without a return because I couldn't provide a bank statement as proof. The bank account I was having didn't have that privilege. All requirements should be stated beforehand.
Anonymous
app not working. tried to use on my smart phone and woudnt sign up.
Here's our experience with WorldRemit
International bank transfer speed
In general, if you’re making a domestic transfer, the funds will be deposited almost instantly in most cases.
However, if you’re making an international transfer, it can take up to 3 days via the bank.
Bank transfer limits
Bank transfer limits will depend on several factors. Here’s a quick breakdown of each:
Daily limits
Many banks impose daily limits on the amount you can transfer internationally. This limit helps mitigate risk and may vary depending on your account type and relationship with the bank. For example, Chase imposes a $25,000 daily limit in the US.
Transaction limits
There may be limits on the amount you can transfer in a single transaction. This can vary significantly between banks and may also depend on whether the transfer is made online, through mobile banking, or at a physical branch. For example, HSBC bank has a $2,500 per transaction limit in the US.
Monthly limits
Some banks also impose monthly limits on international transfers. This is another measure to manage risk and ensure compliance with regulatory requirements.
Country-specific limits
Transfers to certain countries may have additional restrictions or require special authorization due to regulatory considerations or risk factors associated with the destination country. On the other hand, some countries will have no limits but taxes will come into play.
Purpose-specific limits
Depending on the purpose of your transfer (e.g., personal remittance, business payment), there may be different limits or additional documentation requirements.
Bank policies
Each bank sets its limits and policies regarding international transfers, so it’s essential to check with your bank for specific details that apply to your situation.
Alternatives to bank transfers
There are a few alternatives to banks when sending money via bank transfer. Here are a few of them:
Money transfer providers
A popular alternative to traditional banks for making a bank transfer is to use a money transfer service.
These services are often digital-led and therefore have:
Lower overhead costs which enables them to charge lower fees than banks
More competitive exchange rates
Process international transfers in a shorter time
A few examples include Wise, WorldRemit, RegencyFX, and XE.
Neobanks
Neobanks (or challenger banks, or digital-only banks) have lower fees compared to traditional banks. They offer fast transfers, P2P payments, lower fees and most come with a multi-currency account letting you store many currencies in one place.
However, these have no physical branch, usually poorer customer service, and lower limits compared to other banks.
A few good examples of neobanks include Revolut, Monzo, and Starling.
P2P payment apps
P2P payment apps are a good option if you want to send small amounts to friends and family or split the bill.
However, most of the time these will require both people to have the app to initiate the transfer. As well as some will add fees for withdrawing funds to your main bank account.
A few good examples of P2P apps are Zelle, Cash App, and Wise App.
A bit more on bank transfers
What is a BSB number?
The BSB number (Bank-State-Branch number) is an identification code used in Australia to specify a particular bank branch.
When you want to send money to someone's bank account in Australia, you need their BSB number along with their account number (similar to how you need a routing number in the US or a sort code in the UK).
Together, these numbers make sure the money goes to the right bank branch and then to the right account.
Why can't I just use my bank to transfer money abroad?
The honest answer; you can. But traditional banks aren’t set up very well to handle international payments and money transfers.
This is why many other service providers exist, who are specialists in transferring money abroad.
Money transfer companies are designed to provide cheaper ways to send money abroad, whereas, banks take much longer, cost a lot more, and are generally more complex to use.
This is why we always recommend using a specific money transfer provider to send your money abroad.
Help & FAQ
Get answers to the most common questions asked when sending money abroad. Covers costs, fees and the best way to compare.
Let’s recap: what are international bank transfers?
Bank transfers are a secure and convenient way to electronically move money between accounts, domestically or internationally.
Fees and exchange rates will vary from bank to bank, as well as transfer speed can be anywhere between minutes to a few days.
We strongly suggest you consider alternatives like money transfer services for lower fees and competitive rates.
Compare cheapest money transfer options
Sources & further reading
Contributors

Yasmin Purnell

Artiom Pucinskij

Please share your experience with …