Global Data: Remittance Data and Statistics
Author: Keith Hodges
We only list companies that are trustworthy and appropriately licensed. Our aim is to give you a comprehensive view of the regulated money transfer marketplace.
DisclosureMoneyTransfers aims to help users find the best money transfer provider for their needs. To support our free service, we may earn a commission from some of the providers listed in our search results. The commission may also impact the ordering of the providers shown. Our reviews are independent from this and are based on our editorial policy, research and testing of dozens of remittance providers on the market.
I’ve been working in the remittance industry for a number of years now and want to share some of the finer data points that allow us to make informed decisions for our customers.
Feel free to share these as you need, but please do remember to refer back to MoneyTransfers.com when you do.
Search Now & Save On Your Transfer
Instantly view live exchange rates, fees & features.
Table of contents
Table of contents
An overview of all the data trends
The data on this page is compiled from various sources and highlights the changing remittance payment landscape. The UN has a target cost for all remittances to be below 3% of the transfer amount. We have shown this amount on the graphs throughout.
The average cost of sending money, as of December 2023, was just under 8% of the transfer amount. Up from the previous 2 years' 6%.
The total average cost of sending remittances has never been lower than 6% of the transfer cost. This is double the 3% target set by the UN.
An increase in the use of money transfer companies saw a decrease in cost from 8% to 6% between 2017 and 2022. However, Q4 2023 impacts the overall progress made.
The average cost of sending via a money transfer company has been around 6%. This is compared to sending money with a bank, which has maintained an average cost of between 9% and 11% of the total transfer amount.
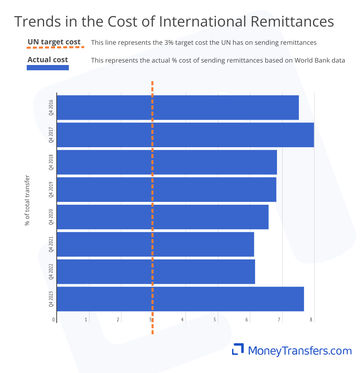
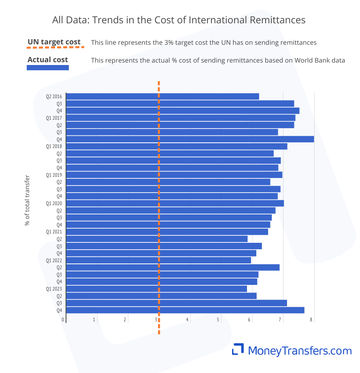
Average cost of sending money
This graph shows the average cost of sending money from 2016 to date and is based on a $200 transfer. This cost is made up of both fees and exchange rates charged by money transfer companies, banks, mobile providers (for things like airtime transfers) and some hybrids where the institution straddles both.
The data below outlines the average cost of sending money in Q4 where the data is currently available. Full data is available in each of the other tabs.
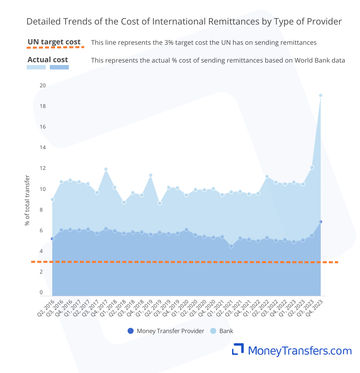
Cost by type of company
The cost of sending money is greatly influenced by the type of company. The graph below illustrates the average cost based on company type, specifically comparing banks to money transfer providers.
For the most part, banks and money transfer companies are the most popular ways of sending money (generally a money transfer company will be the cheapest). This data shows the average cost of each per quarter. As a reference point we have used Q4 for each year.
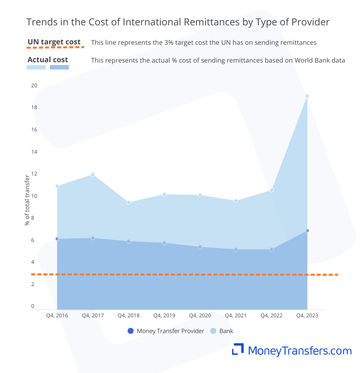
Why are money transfer companies cheaper?
Generally, a money transfer company is cheaper than a bank for sending money because they use their own network. Banks often cost more to send as they may have to use intermediary networks to ensure funds move correctly.
Average FX markups
The markup as part of a transfer can equate to hidden costs or a hidden fee for sending money. Essentially, the higher the markup, the less a recipient will eventually end up with.
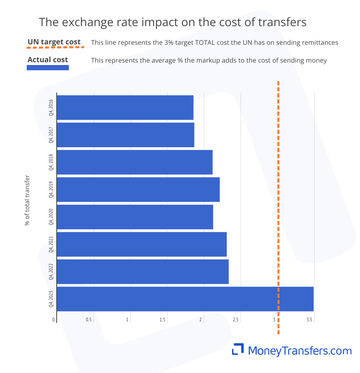
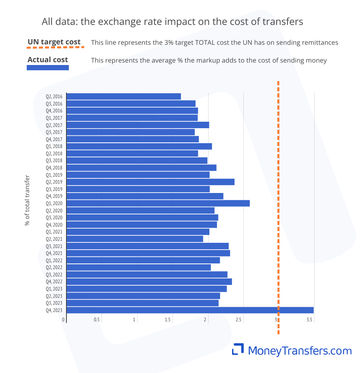
The average exchange rate markup has increased every year (barring 2020) since 2016. Generally, this has remained below the overall 3% target for overall cost - averaging between 1.8-2.2%.
Banks and money transfer companies are relatively in line with each other when comparing exchange rates.
The graph shows the average exchange rate cost for global money transfers since 2016.
FX Markup by type of company
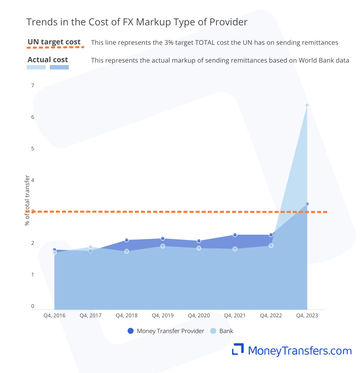
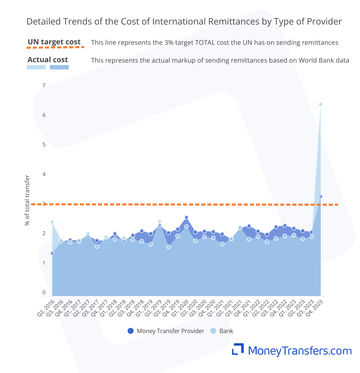
The below graphs show the same trends and changes by the type of company. This again focuses on banks and money transfer companies as the most popular way of sending money internationally.
This graphs shows how money transfer companies and banks have offered different exchange rates on global transfers since 2016.
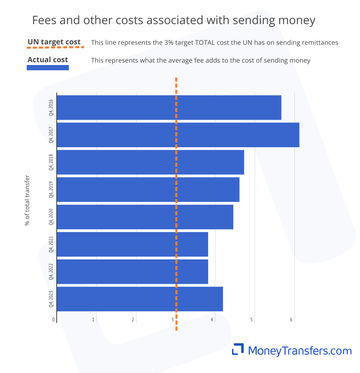
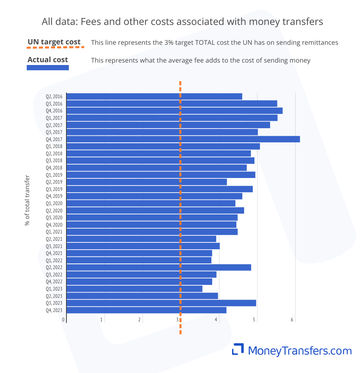
Fees and other costs
This data shows the other costs and fees associated to sending money as a percentage of the overall transfer. Data is from 2016 to date. Generally, these will be fees charged, intermediary fees, and receiving fees.
The average fee for sending money has only been below 4% of the total transfer amount in two of the years tracked (2021 and 2022).
By and large, the average cost in fees is being driven by banks - at over 7%. Money transfer companies see average fees in the 4% region in 2016, dropping to below 3% in 2023.
This data shows fees as a percentage cost of a transfer. This data is global and for Q4 of each year since 2016.
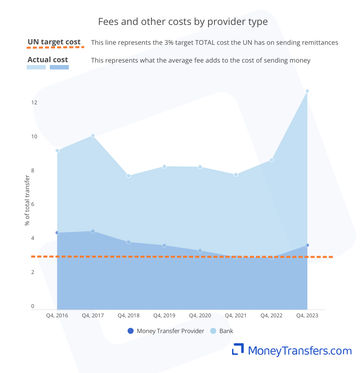
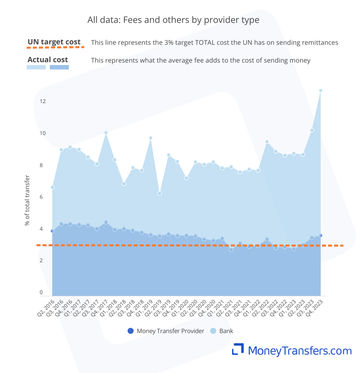
Fees and other costs by company type
The below graphs show the same trends and changes by the type of company. This again focuses on banks and money transfer companies as the most popular way of sending money internationally.
The following graph shows the average fee payment to both money transfer operators and banks as a percentage of the total transfer amount.
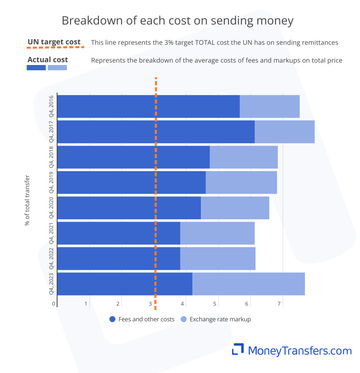
How exchange rate markup and fees make up the total cost
The below graph shows the split between the exchange rate and other costs that make up the average cost of a transfer.
Looking at the split of sending money by cost, fees charged dd a significant portion to the overall cost.
Money transfer operators and mobile operators (airtime) are the cheapest options for sending money. Airtime becomes less cost-effective at higher transfer amounts.
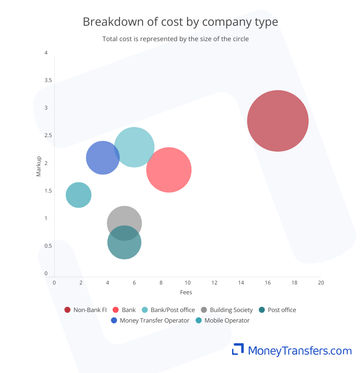
Exchange rate and fees by type of company
Within this, we have covered some hybrid companies, post offices, and mobile operators as well. The figures for these are correct, but testing was done with far fewer transfers.
Data for the type of company
Type | Fees | FX Markup | Total Cost |
|---|---|---|---|
Non-Bank FI | 16.76% | 2.83% | 19.59% |
Bank | 8.59% | 1.93% | 10.53% |
Bank/Post office | 6.00% | 2.35% | 8.35% |
Building Society | 5.26% | 0.97% | 6.23% |
Post office | 5.25% | 0.62% | 5.88% |
Money Transfer Operator | 3.64% | 2.16% | 5.80% |
Mobile Operator | 1.82% | 1.48% | 3.30% |
Our data
This data has been compiled from the following sources:
WorldBank and UN data on access to remittance and the cost of remittances through different provider types.
Live data from our own comparison engine.
All data has been edited and fact checked by our team.
Explore remittance statistics
Our remittance data center is always growing.
We often cover new topics and will regularly update reports as new data emerges.
Wise Transfer Fees
Here's a quick summary of Wise transfer fees and our findings.

.svg)
South America: Remittance Data and Statistics
The data and graphs below highlight the average cost of sending a $200 transfer to South America. This data includes money transfer companies, banks, post offices, and other financial institutions.The average 3% target set by the UN is also presented in the graphs.


Europe: Remittance Data and Statistics
This graph shows the average cost of sending money into Europe from 2016 to date and is based on a $200 transfer. This includes countries that support EUR to EUR transfers as well. We have included these to highlight the impact of unreasonably high fees on the overall cost of sending money.

North America: Remittance Data and Statistics
The data below shows the average cost of sending $200 to North America as a percentage of the amount sent.

Asia: Remittance Data and Statistics
This graph shows the average cost of sending money from 2016 to date and is based on a $200 transfer to Asia. This cost is a combination of fees and foreign exchange rates between the origin countries and Asian countries.

Data Center

Africa: Remittance Data and Statistics
This graph shows the average cost of sending money from 2016 to date and is based on a $200 transfer to Africa. The cost is a combination of fees and exchange rates.
Wise Transfer Fees
Here's a quick summary of Wise transfer fees and our findings.
South America: Remittance Data and Statistics
The data and graphs below highlight the average cost of sending a $200 transfer to South America. This data includes money transfer companies, banks, post offices, and other financial institutions.The average 3% target set by the UN is also presented in the graphs.
Europe: Remittance Data and Statistics
This graph shows the average cost of sending money into Europe from 2016 to date and is based on a $200 transfer. This includes countries that support EUR to EUR transfers as well. We have included these to highlight the impact of unreasonably high fees on the overall cost of sending money.
North America: Remittance Data and Statistics
The data below shows the average cost of sending $200 to North America as a percentage of the amount sent.
Asia: Remittance Data and Statistics
This graph shows the average cost of sending money from 2016 to date and is based on a $200 transfer to Asia. This cost is a combination of fees and foreign exchange rates between the origin countries and Asian countries.
Contributors

Please share your experience with …