South America: Remittance Data and Statistics
Table of contents
.svg)
Author: Keith Hodges
Editor: Artiom Pucinskij
We only list companies that are trustworthy and appropriately licensed. Our aim is to give you a comprehensive view of the regulated money transfer marketplace.
Table of contents
Within this data we have outlined the average cost of remittances to South America. This data uses multiple sources and is tracked across different transfer providers.
An overview of South American remittance data
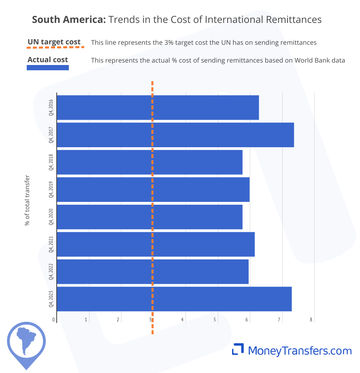
The average cost of remittance to South America has been between 6-7% for the last 8 years.
Banks have, on average, been between 1-2% more expensive than sending through a money transfer company.
Remittances into South America are, on average, getting more expensive. Two quarters at the end of 2023 saw average costs of over 7%.
Only Q2 of 2016 has seen average costs below 5% when sending to South America.
Average cost of sending money into South America
The data and graphs below highlight the average cost of sending a $200 transfer to South America. This data includes money transfer companies, banks, post offices, and other financial institutions.The average 3% target set by the UN is also presented in the graphs.
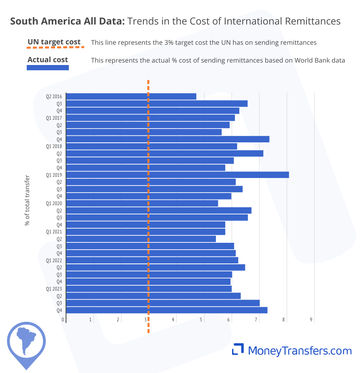
The data below outlines the average cost of sending money into South America. This includes money transfer operators, banks and other types of companies that allow transfers into the region.
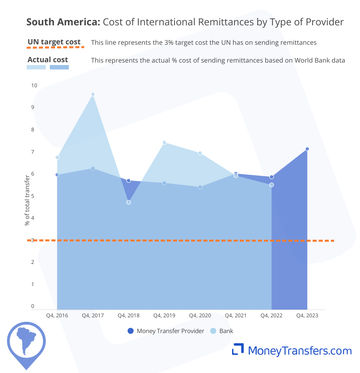
South America: Cost by type of company
The cost of sending money into South America differs by the type of company being used. For the most part, money transfer companies have been cheaper than banks. Over time, banks have been more susceptible to instability into some South American markets.
The data below highlights the cost in Q4 of each year, to giving an overall trend of how the cost of sending money into South America has changed annually. Currently, there is no available data for Q4 2023 bank costs.
Why are money transfer companies cheaper?
Generally, a money transfer company is cheaper for sending money between two countries because they use their own network.
Average FX markups for transfers to South America
The markup as part of a transfer can equate to hidden costs or a hidden fee for sending money into South America. Essentially, the higher the markup, the less the recipient will eventually end up with.
The cost of sending remittances to South America has been impacted, in part, by exchange rate changes. The average markup seen between 2016 and 2017 was 1.7%, and by 2022 to 2023, this had increased to 2.7%.
Over the period from 2016, to date, banks have offered better exchange rates on transfers into South America. This is offset by higher fees.
This data shows the average exchange rate for remittances entering South America from 2016 to 2023.
South America: FX Markup by type of company
The below graphs show the same trends and changes based on the type of company for remittances to South America. This again focuses on banks and money transfer companies as the most popular methods of sending money into the continent.
This graphs highlights how exchange rates from banks and money transfer providers have changed over time.
Fees and other costs for transfers to South America
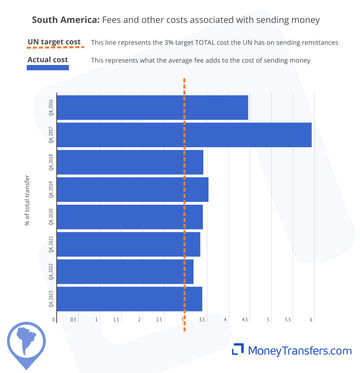
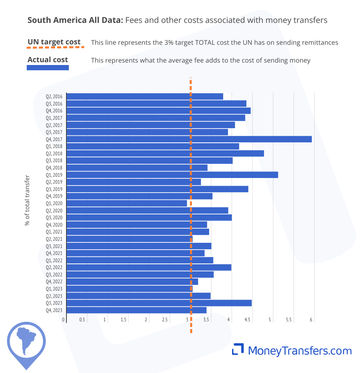
This data shows the other costs and fees associated to sending money into South America as a percentage of the overall transfer. Data is from 2016 to date. Generally, these will be fees charged and potentially intermediary fees and receiving fees.
The average cost of fees from money transfer providers has been 3%, compared to the average fees from banks at 5%.
In 2023, money transfer company fees were around 3% cheaper than using banks.
The following data shows average fees for remittances into South America since 2016.
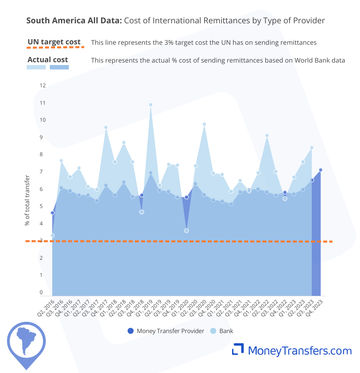
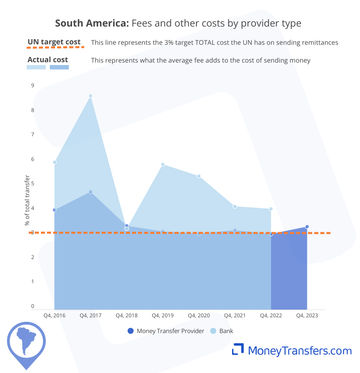
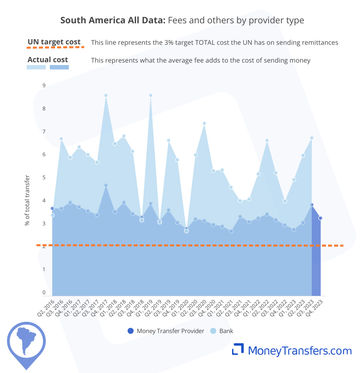
South America: Fees and other costs by company type
The data below shows the same trends for South America by the type of company
.
The data in this graph shows the average fee for transfers by a percentage of the transfer amount into South America. This data is split by money transfer operators and banks.
Exchange rate and markup combined
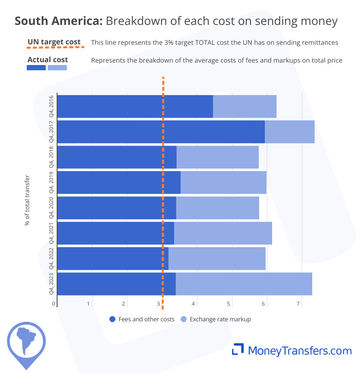
The graph below shows the split between the exchange rate and other costs that constitute the average cost of a transfer to a country in South America.
South America is slightly cheaper than the global average cost of sending money (7.29% vs 7.67%).
This being said, South American remittances are still 4.29% higher than the 3% target cost rate.
More recently, the average fee makes up over 50% of the cost of sending money into South America. This suggests that banks and money transfer companies are charging a slight premium for customers to access the market.
Exchange rate and fees by type of company
Money transfer operators are the cheapest option, despite having the highest average markup. This is because fees to South America are lower than those of other company types.
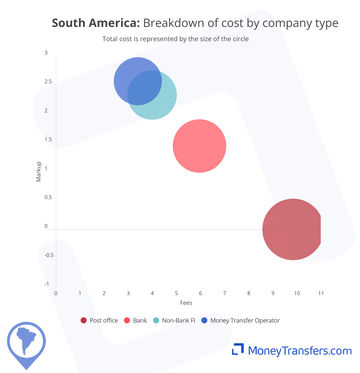
Data for the type of company
Type | Fees | FX Markup | Total Cost |
|---|---|---|---|
Post office | 9.84% | 0% | 9.84% |
Bank | 5.96% | 1.44% | 7.40% |
Non-Bank FI | 3.99% | 2.33% | 6.32% |
Money Transfer Operator | 3.40% | 2.57% | 5.96% |
Our data
This data has been compiled from the following sources:
WorldBank and UN data on access to remittance and the cost of remittances through different provider types.
Live data from our own comparison engine.
All data has been edited and fact checked by our team.
Explore remittance statistics
Our remittance data center is always growing.
We often cover new topics and will regularly update reports as new data emerges.
Wise Transfer Fees
Here's a quick summary of Wise transfer fees and our findings.


Global Data: Remittance Data and Statistics
The data on this page is compiled from various sources and highlights the changing remittance payment landscape. The UN has a target cost for all remittances to be below 3% of the transfer amount. We have shown this amount on the graphs throughout.


Europe: Remittance Data and Statistics
This graph shows the average cost of sending money into Europe from 2016 to date and is based on a $200 transfer. This includes countries that support EUR to EUR transfers as well. We have included these to highlight the impact of unreasonably high fees on the overall cost of sending money.

North America: Remittance Data and Statistics
The data below shows the average cost of sending $200 to North America as a percentage of the amount sent.

Asia: Remittance Data and Statistics
This graph shows the average cost of sending money from 2016 to date and is based on a $200 transfer to Asia. This cost is a combination of fees and foreign exchange rates between the origin countries and Asian countries.

Data Center

Africa: Remittance Data and Statistics
This graph shows the average cost of sending money from 2016 to date and is based on a $200 transfer to Africa. The cost is a combination of fees and exchange rates.
Contributors

Keith Hodges

Please share your experience with …