Europe: Remittance Data and Statistics
Table of contents

Author: Keith Hodges
Editor: Artiom Pucinskij
We only list companies that are trustworthy and appropriately licensed. Our aim is to give you a comprehensive view of the regulated money transfer marketplace.
DisclosureMoneyTransfers aims to help users find the best money transfer provider for their needs. To support our free service, we may earn a commission from some of the providers listed in our search results. The commission may also impact the ordering of the providers shown. Our reviews are independent from this and are based on our editorial policy, research and testing of dozens of remittance providers on the market.
Table of contents
This data page covers the average costs since 2016 for sending money to Europe. This includes the average fee and exchange rate paid.
Banks and money transfer companies are the most popular ways to send remittance to Europe and make up most of this data.
Remittance statistics for Europe
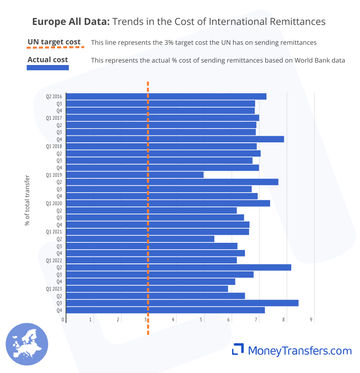
The cost of sending money to Europe has been above 5% consistently since 2019, except for Q1 2019, where the average cost was 4.97%.
Q3 2023 saw the highest average cost, at 8.42%. This is only the second time the average cost exceeded 8%. The first instance was in Q2 2022, at 8.15%.
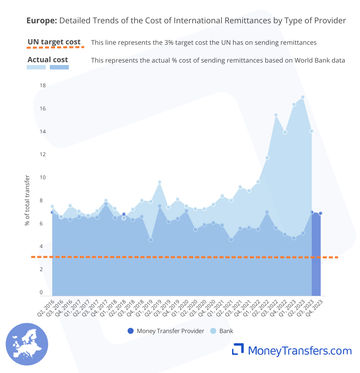
Banks, on average, have hugely increased the cost for transfers into Europe. Since Q2 2022, transferring to Europe using a bank account has been at least 12%, but has been as high as 17%.
Despite banks being able to offer a more competitive exchange rate between countries supporting the EUR, the amount charged in fees for international transfers still makes them the most expensive option.
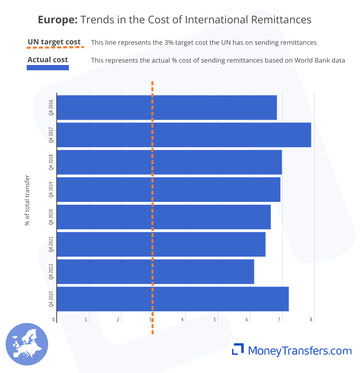
Average cost of sending money to Europe
This graph shows the average cost of sending money into Europe from 2016 to date and is based on a $200 transfer. This includes countries that support EUR to EUR transfers as well. We have included these to highlight the impact of unreasonably high fees on the overall cost of sending money.
The data below outlines the average cost of sending money to Europe in the last quarter of every year. Full data is in each of the other tabs.
Europe: Cost by type of company
Banks and money transfer operators are generally the most popular ways of sending money to Europe. The data below focuses on these types of company.
Q4 2023 is not yet available for banks, but we can see a general trend in cost increases for transfers into,and within Europe.
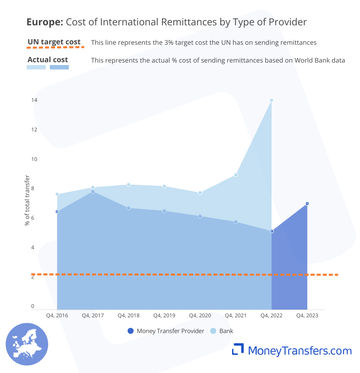
Why are money transfer companies cheaper for transfers to Europe?
Generally, a money transfer company is cheaper for sending money to Europe than a bank because they use their own network.
Average FX markups for transfers to Europe
The markup, as part of a transfer, can equate to hidden costs or a hidden fee for sending money. Essentially, the higher the markup, the less a recipient in Europe will eventually end up with.
Average FX markup to Europe is one of the cheapest among continents. This is due to the use of the Euro across multiple countries.
Banks can offer a mid-market rate on transfers, but often fall down on fees added.
Money transfer companies offer an average markup of around 2%.
The average bank exchange rate has stayed under 1% since data has been recorded.
The graph below shows the average FX markup for transfers into Europe. The increase in Q4 2023 is a result of no data for banks being available at the time of writing. With many banks offering no markup, removing this has increased the average.
FX Markup by type of company
The below graphs show the same trends and changes by company type. This again focuses on banks and money transfer companies as the most popular provider types for sending money internationally.
FX markup from banks has been under 1% on average since 2016. Money transfer companies remain competitive by offering lower fees.
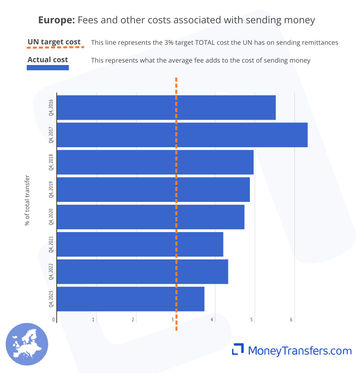
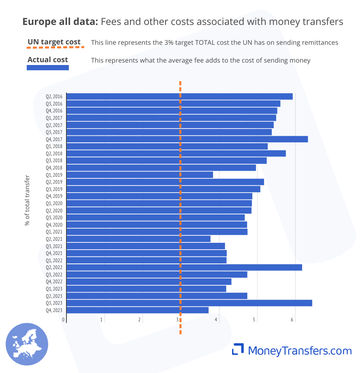
Fees and other costs for remittance into Europe
This data shows the other costs and fees associated with sending money into Europe as a percentage of the overall transfer. The data is from 2016 to date. Generally, these will be fees charged, potentially including intermediary fees and receiving fees.
Fees for sending money to Europe have shown consistent decreases since 2016, with Q4 2023 at 3.42% compared to the starting number of 5.93%.
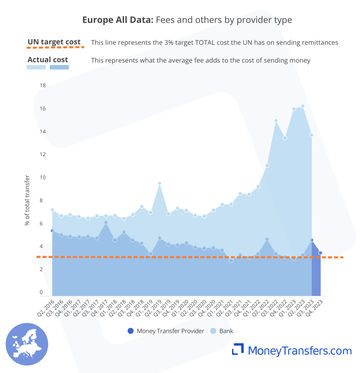
Fees for using a bank hit just under 14% of the amount of a transfer into Europe at the end of 2022. In Q1 and Q2 of 2023, this increased to over 16%.
For comparison, fees for money transfer companies were between 3% and 3.70% for the same period, hitting a brief high of 4.85% in Q3 2023 before returning to normal.
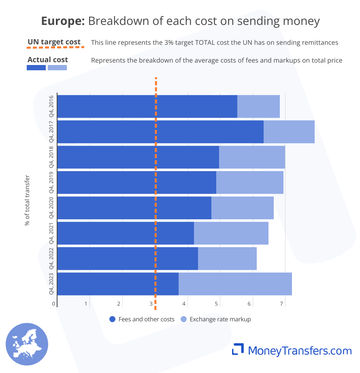
The below graph shows the average cost of sending money to Europe, alongside the overall UN target of 3%.
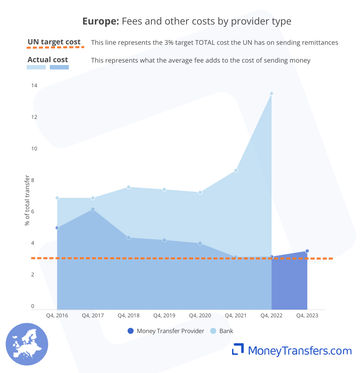
Fees and other costs by company type
The below graphs show the same fee trends and how they have changed by company type. Again this data focuses on banks and money transfer companies as the most popular way of sending money internationally.
The below graph shows the average fee as a percentage of the total transfer amount for a $200 transfer into Europe. Currently, data for the cost of sending through a bank is not available for Q3 2023.
How exchange rate markup and fees make up the total cost
The below graph shows the split between the exchange rate and other costs that make up the average cost of a transfer.
Generally, a money transfer operator is the cheapest option for sending money to Europe. This is because the combination of lower fees and a slightly higher exchange rate outweighs the lower exchange rate and high fees charged by a bank.
On average, the exchange rate markup makes up about 60% of the total cost of sending money to Europe. Compared to South America, where the amount is around 50%.
Exchange rate and fees by type of company
Exchange rate and fees by type of companyIn this section, we have covered various types of companies, including hybrid companies, post offices, and mobile operators. The figures provided for these companies are accurate, although the testing was conducted with a smaller number of transfers.
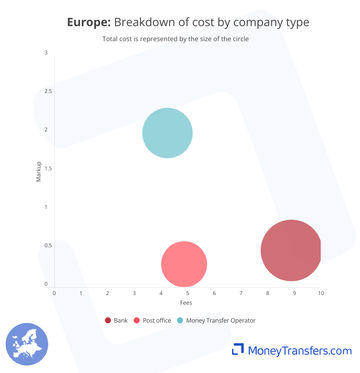
Data for the type of company
Type | Fees | FX Markup | Total Cost |
|---|---|---|---|
Bank | 8.89% | 0.48% | 9.36% |
Post office | 4.87% | 0.30% | 5.16% |
Money Transfer Operator | 4.24% | 2.00% | 6.25% |
Our data
This data has been compiled from the following sources:
WorldBank and UN data on access to remittance and the cost of remittances through different provider types.
Live data from our own comparison engine.
All data has been edited and fact checked by our team.
Explore remittance statistics
Our remittance data center is always growing.
We often cover new topics and will regularly update reports as new data emerges.
Wise Transfer Fees
Here's a quick summary of Wise transfer fees and our findings.


Global Data: Remittance Data and Statistics
The data on this page is compiled from various sources and highlights the changing remittance payment landscape. The UN has a target cost for all remittances to be below 3% of the transfer amount. We have shown this amount on the graphs throughout.

.svg)
South America: Remittance Data and Statistics
The data and graphs below highlight the average cost of sending a $200 transfer to South America. This data includes money transfer companies, banks, post offices, and other financial institutions.The average 3% target set by the UN is also presented in the graphs.

North America: Remittance Data and Statistics
The data below shows the average cost of sending $200 to North America as a percentage of the amount sent.

Asia: Remittance Data and Statistics
This graph shows the average cost of sending money from 2016 to date and is based on a $200 transfer to Asia. This cost is a combination of fees and foreign exchange rates between the origin countries and Asian countries.

Data Center

Africa: Remittance Data and Statistics
This graph shows the average cost of sending money from 2016 to date and is based on a $200 transfer to Africa. The cost is a combination of fees and exchange rates.
Contributors

Keith Hodges

Please share your experience with …