Africa: Remittance Data and Statistics
Table of contents

Author: Keith Hodges
Editor: Artiom Pucinskij
We only list companies that are trustworthy and appropriately licensed. Our aim is to give you a comprehensive view of the regulated money transfer marketplace.
DisclosureMoneyTransfers aims to help users find the best money transfer provider for their needs. To support our free service, we may earn a commission from some of the providers listed in our search results. The commission may also impact the ordering of the providers shown. Our reviews are independent from this and are based on our editorial policy, research and testing of dozens of remittance providers on the market.
Table of contents
The following page covers data and statistics regarding remittances to Africa.
This covers the total cost broken, which is down by fees and exchange rates, as well as the type of provider.
Africa remittance statistics
Africa is one of the most expensive places to send money to with current costs at around 10% of the transfer amount.
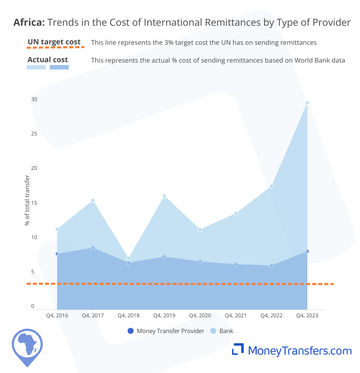
The cost of sending money to Africa through a bank has increased from 11.65% of the transfer amount (Q4 2020) to 29% of the transfer amount (Q4 2023).
Money transfer companies have decreased in price by around 1% since 2026, but still cost more than double the UN target rate at 6.34%.
Since 2016, sending money with a money transfer company would be around 1/3 of the cost of sending with a bank.
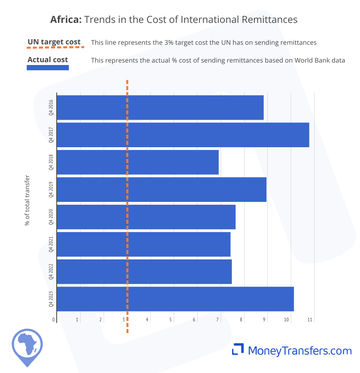
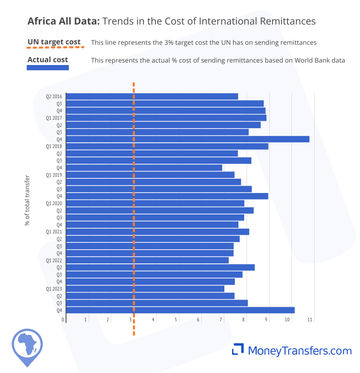
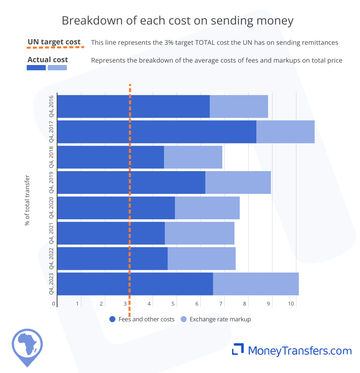
Average cost of sending money to Africa
This graph shows the average cost of sending money from 2016 to date and is based on a $200 transfer to Africa. The cost is a combination of fees and exchange rates.
This data shows the average overall cost of sending money into Africa in Q4 of each year. This provides a general insight to how trends have changed.
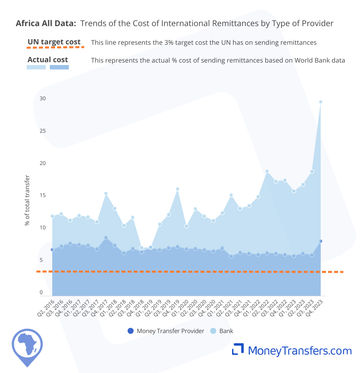
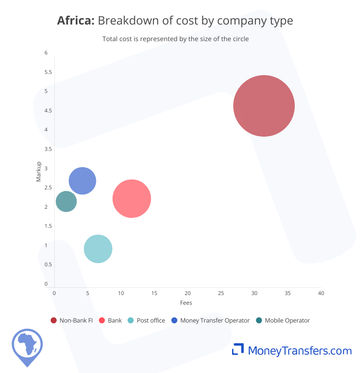
Cost by type of company
Money transfer companies and banks are the most common ways of sending money into Africa. The following graphs break down the cost of sending money through each type.
Banks have been the most expensive way to send money into Africa, a trend that shows no sign of changing in the near or medium term.
Why are money transfer companies cheaper?
Generally, a money transfer company is cheaper for sending money into Africa because they use their own network.
Average FX markups
The markup, as part of a transfer, can equate to hidden costs or a hidden fee for sending money. Essentially, the higher the markup, the less a recipient will eventually end up with.
The average exchange rates for sending money into Africa are around 2.5-3%. This is one of the higher numbers. Europe, for example, consistently stays under 2% for transfers in.
From 2016 to mid-2022, money transfer operators had the highest exchange rates for transfers into Africa. However, since mid-2022, banks have been charging more. During this time, money transfer company rates have remained relatively static at around 2.80% to 3%. Banks exchange rates increased from around 2.40% to 3.40%.
This data shows the average exchange rate for transfers to Africa since 2016.
FX Markup by type of company
The below graphs show the exchange trends by the type of company. This focuses on banks and money transfer companies as the most popular ways of sending money into Africa.
This graph shows the changing trends in exchange rate costs at the end of each year for which the data is available.
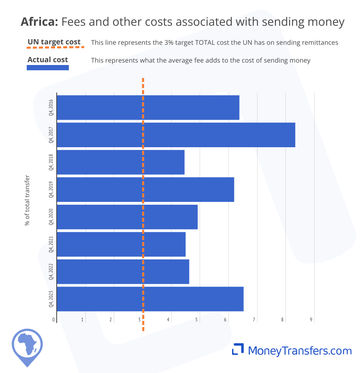
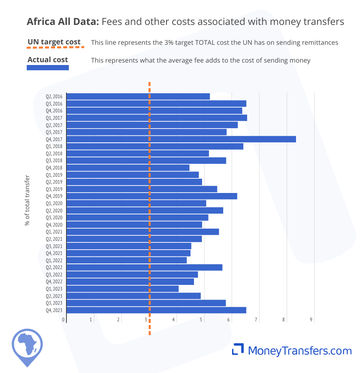
Fees and other costs
This data shows the other costs and fees associated with sending money to Africa as a percentage of the overall transfer. The data is from 2016 to date. Generally, these will be fees charged, potentially intermediary fees and receiving fees charged by banks.
Fees for money transfer companies average around 4%, with bank fees being more than 10% for most quarters where data is available.
Over the last 3 years, the average cost as a total percentage amount for sending through a money transfer company has been between 3% and 4%.
In the same period (from 2021) bank costs have increased from 10.87% to 20.30%.
This is the average fee associated with sending money to Africa. This fee is a percentage of the total transferred amount.
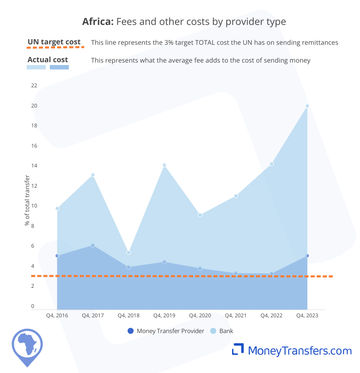
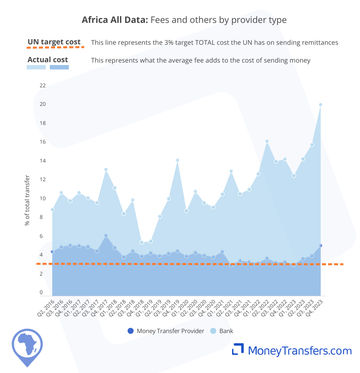
Fees and other costs by company type
These graphs show the average costs by type of provider. This focuses on money transfer companies and banks.
This is the average cost in the final quarter of each year for sending money to Africa.
How exchange rate markup and fees make up the total cost
This section outlines how the different costs make up the whole cost. This provides an insight into how the different costs are cause overall amounts to exceed the 3% UN target.
This an outlier among mobile operators for sending airtime, as they have average fees and costs of under 2%. However, they are only really useful for smaller transfer amounts.
Most of the cost of sending money to Africa is a result of fees (almost two-thirds). This is particularly noticeable with banks.
Exchange rate and fees by type of company
This data shows the overall costs by type of company. Mobile operators appear here as one of the cheaper options, but come with low limits on transfer amounts.
Data for the type of company
Type | Fees | FX Markup | Total Cost |
|---|---|---|---|
Bank | 8.89% | 0.48% | 9.36% |
Post office | 4.87% | 0.30% | 5.16% |
Money Transfer Operator | 4.24% | 2.00% | 6.25% |
Our data
This data has been compiled from the following sources:
WorldBank and UN data on access to remittance and the cost of remittances through different provider types.
Live data from our own comparison engine.
All data has been edited and fact checked by our team.
Explore remittance statistics
Our remittance data center is always growing.
We often cover new topics and will regularly update reports as new data emerges.
Wise Transfer Fees
Here's a quick summary of Wise transfer fees and our findings.


Global Data: Remittance Data and Statistics
The data on this page is compiled from various sources and highlights the changing remittance payment landscape. The UN has a target cost for all remittances to be below 3% of the transfer amount. We have shown this amount on the graphs throughout.

.svg)
South America: Remittance Data and Statistics
The data and graphs below highlight the average cost of sending a $200 transfer to South America. This data includes money transfer companies, banks, post offices, and other financial institutions.The average 3% target set by the UN is also presented in the graphs.

Europe: Remittance Data and Statistics
This graph shows the average cost of sending money into Europe from 2016 to date and is based on a $200 transfer. This includes countries that support EUR to EUR transfers as well. We have included these to highlight the impact of unreasonably high fees on the overall cost of sending money.

North America: Remittance Data and Statistics
The data below shows the average cost of sending $200 to North America as a percentage of the amount sent.

Asia: Remittance Data and Statistics
This graph shows the average cost of sending money from 2016 to date and is based on a $200 transfer to Asia. This cost is a combination of fees and foreign exchange rates between the origin countries and Asian countries.

Data Center
Contributors

Keith Hodges

Please share your experience with …