North America: Remittance Data and Statistics
Table of contents

Author: Keith Hodges
We only list companies that are trustworthy and appropriately licensed. Our aim is to give you a comprehensive view of the regulated money transfer marketplace.
DisclosureMoneyTransfers aims to help users find the best money transfer provider for their needs. To support our free service, we may earn a commission from some of the providers listed in our search results. The commission may also impact the ordering of the providers shown. Our reviews are independent from this and are based on our editorial policy, research and testing of dozens of remittance providers on the market.
Table of contents
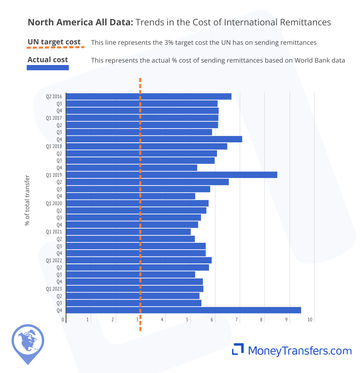
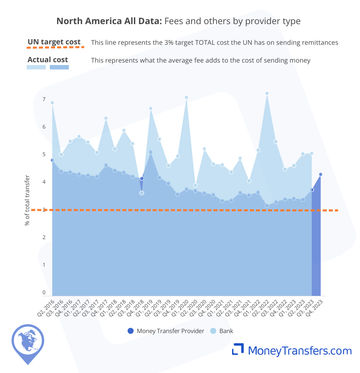
This data shows remittance statistics for transfers to North American countries.
This data highlights the average cost as a percentage of the transfer amount.
Data trends for North America
North America has one of the cheapest average costs for remittance. Between 2018 and 2022, costs were around 5%. For comparison, Europe was around 7%.
Money transfer companies and banks have shown similar trends for sending money to North America. Both have decreased their average costs by around 1.4% from 2016 to date.
Money transfer providers have continued to be around 1% less of the total transfer than sending through a bank.
Despite being a competitive and largely accessible market, North America has also not yet hit the 3% target set by the UN for transfer costs.
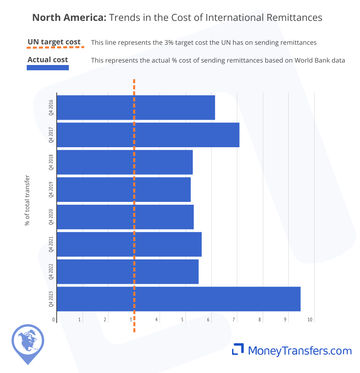
Average cost of sending money
The data below shows the average cost of sending $200 to North America as a percentage of the amount sent.
The data below outlines the average cost of sending money in Q4 where the data is currently available. Full data is available in each of the other tabs.
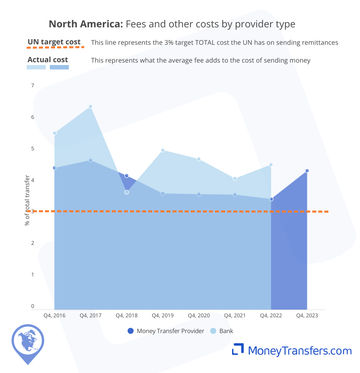
Cost by type of company
Money transfer companies and banks are the most popular ways to send money to North America. This data focuses on the average cost of using each service since 2016.
Generally, money transfer operators have remained cheaper than banks for remittances into North America. Q4 2023 data for banks is not yet available.


Why are money transfer companies cheaper?
Generally, a money transfer company is cheaper for sending money into North America because they use their own network. A bank may need to use an intermediary which can increase costs.
Average FX markups for North American remittances
The markup, as a part of a transfer, can equate to hidden costs or a hidden fee for sending money. Essentially, the higher the markup, the less the recipient will eventually end up with. This markup is represented as a percentage and is what is charged on top of the mid-market rate.
Average exchange rates to North America are often below 2%, and have averaged 1.5% since 2016.
Both banks and money transfer operators maintain competitiveness in this market. The lowest rate offered by a bank was 1.06%, although this irate is specific to certain countries. Money transfer providers have seen rates as low as 1.2%, but a few companies are offering the mid-market rate.
This data shows the exchange rate on transfers to North America. If no fees were included, using only the exchange rate, the cost of sending remittances to North America would exceed UN targets of 3%.
FX Markup by type of company
The following shows the same trends and changes by the type of company. This focuses on banks and money transfer companies as the most popular ways of sending money into North America.
This graph shows the average exchange rate split by type of company in Q4 of each year. At the time of writing, Q4 2023 data is not fully available for banks.
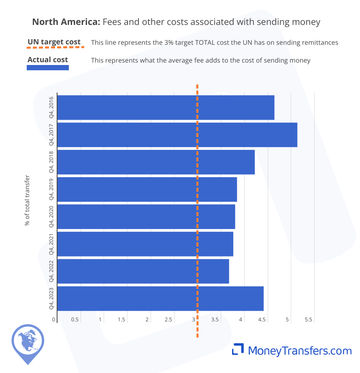
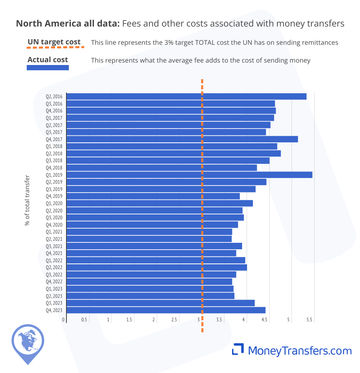
Fees and other costs
This data shows the other costs and fees associated with sending money to North America as a percentage of the overall transfer. Data is from 2016 to date. Generally, these will be fees charged and potentially intermediary fees and receiving fees.
Fees for remittances to North America have never averaged below 3.5%.
Money transfer companies tend to offer fees that reduce the cost by 1.5% when compared to banks.
In only one quarter (Q4 2018), banks have offered lower fees than money transfer companies. These were 3.73% and 4.26% respectively.
Fees for remittances into North America, fees sit just about the target overall 3% rate. Largely driven by bank costs.
Fees and other costs by company type
The graphs below show the same trends and changes the company type. This again focuses on banks and money transfer companies as the most popular ways of sending money internationally.
Fees here have been split by banks and money transfer companies as a percentage of the overall transfer amount.
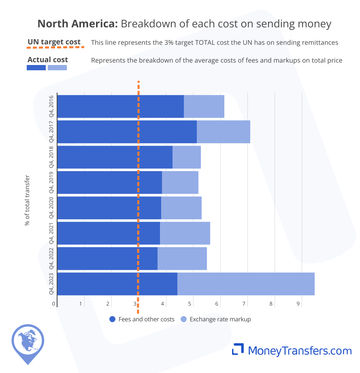
How exchange rate markup and fees make up the total cost
The graph below shows the split between the exchange rate and other costs that make up the average cost of a transfer.
More than any other continent, fees are the main driver behind not reaching the UN cost targets of 3%.
Most costs are consistent; however Q4 2023 shows an abnormally large increase in the overall cost of sending to North America. This data is likely to settle as more becomes available.
Exchange rate and fees by type of company
Within this we have covered some hybrid companies, post offices and mobile operators as well. The figures for these are correct, but testing was done with far fewer transfers.

Data for the type of company
Type | Fees | FX Markup | Total Cost |
|---|---|---|---|
Bank | 8.89% | 0.48% | 9.36% |
Post office | 4.87% | 0.30% | 5.16% |
Money Transfer Operator | 4.24% | 2.00% | 6.25% |
Our data
This data has been compiled from the following sources:
WorldBank and UN data on access to remittance and the cost of remittances through different provider types.
Live data from our own comparison engine.
All data has been edited and fact checked by our team.
Explore remittance statistics
Our remittance data center is always growing.
We often cover new topics and will regularly update reports as new data emerges.
Wise Transfer Fees
Here's a quick summary of Wise transfer fees and our findings.


Global Data: Remittance Data and Statistics
The data on this page is compiled from various sources and highlights the changing remittance payment landscape. The UN has a target cost for all remittances to be below 3% of the transfer amount. We have shown this amount on the graphs throughout.

.svg)
South America: Remittance Data and Statistics
The data and graphs below highlight the average cost of sending a $200 transfer to South America. This data includes money transfer companies, banks, post offices, and other financial institutions.The average 3% target set by the UN is also presented in the graphs.

Europe: Remittance Data and Statistics
This graph shows the average cost of sending money into Europe from 2016 to date and is based on a $200 transfer. This includes countries that support EUR to EUR transfers as well. We have included these to highlight the impact of unreasonably high fees on the overall cost of sending money.

Asia: Remittance Data and Statistics
This graph shows the average cost of sending money from 2016 to date and is based on a $200 transfer to Asia. This cost is a combination of fees and foreign exchange rates between the origin countries and Asian countries.

Data Center

Africa: Remittance Data and Statistics
This graph shows the average cost of sending money from 2016 to date and is based on a $200 transfer to Africa. The cost is a combination of fees and exchange rates.
Contributors

Please share your experience with …