Asia: Remittance Data and Statistics
Table of contents

Author: Keith Hodges
Editor: Artiom Pucinskij
We only list companies that are trustworthy and appropriately licensed. Our aim is to give you a comprehensive view of the regulated money transfer marketplace.
DisclosureMoneyTransfers aims to help users find the best money transfer provider for their needs. To support our free service, we may earn a commission from some of the providers listed in our search results. The commission may also impact the ordering of the providers shown. Our reviews are independent from this and are based on our editorial policy, research and testing of dozens of remittance providers on the market.
Table of contents
This page covers the average costs and trends associated with sending money to Asia.
This data covers how fees, the exchange rate, and the type of company can impact the overall cost of transfers to different locations in Asia.
Overview of statistics into Asia
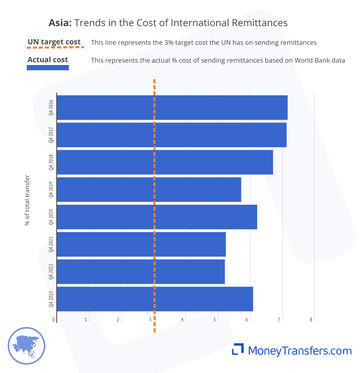
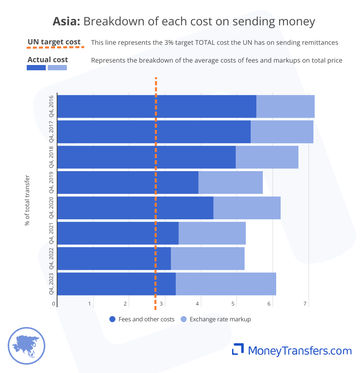
Average remittance costs into Asia have dropped from 7% in 2016 to 6% in 2023. In 2022, these were as low as 5%.
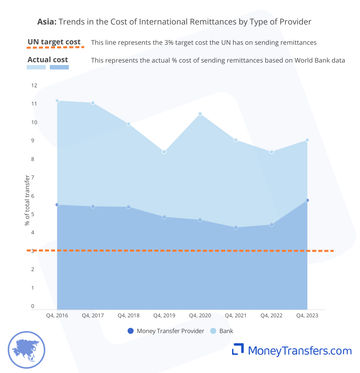
Banks are around twice the cost of money transfer companies. In Q3 2023, the average cost of sending into Asia through a money transfer company was 5.01%. Through a bank, it was 10.32%.
Exchange rates are more competitive with money transfer providers. For the majority of 2022 and 2023, somebody sending through a money transfer operator would get an exchange rate around 0.5% better than sending with a bank.
Fees make a huge difference in the overall cost of transfers in Asia. Money transfer companies offer fees in the range of 1-3%, with bank averages exceeding 6%.
Average cost of sending money to Asia
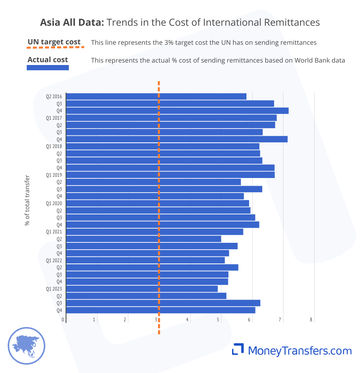
This graph shows the average cost of sending money from 2016 to date and is based on a $200 transfer to Asia. This cost is a combination of fees and foreign exchange rates between the origin countries and Asian countries.
The data below outlines the average cost of sending money in the last quarter of each year the data is available.
Cost by type of company
The tabs below outline the difference in the cost of sending money by type of company. This focuses on sending money through either banks or money transfer operators. These two methods are the most popular options for transfers into Asia.
This graph shows the average cost of sending money to through both banks and money transfer operators. It is aligned with the UN target cost.
Why are money transfer companies cheaper?
Generally, a money transfer company is cheaper for sending money into Asia. This is because a money transfer company will use their own network, whereas banks can result in the need to pay intermediary fees.
Average FX markups
The markup as a part of a transfer can equate to hidden costs or a hidden fee for sending money. Essentially, the higher the markup, the less the recipient will eventually end up with. This is always given as a percentage above the mid-market rate.
Exchange rates for sending money into Asia have been increasing since 2016, from 1.6% to 2.8%.
In the last year, banks have offered a slightly better average exchange rate (1.64%) than money transfer companies (1.88%).
However, in Q4 2023, this average turned back to money transfer companies (2.77%), with banks (3.22%) seeing a jump in the average exchange rate offered.
This data shows the average exchange rate markup offered by banks and money transfer companies over the 8-year period.
FX Markup by type of company
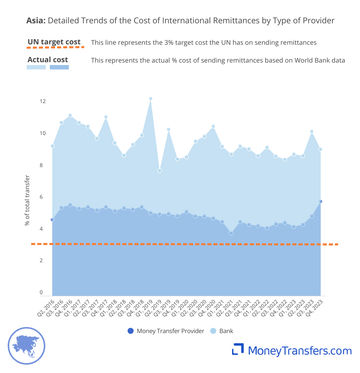
The graphs below show statistics for the average exchange rate markup based on the type of company.
This table shows the average exchange rate markup offered by both banks and money transfer operators within the analyzed timeframe.
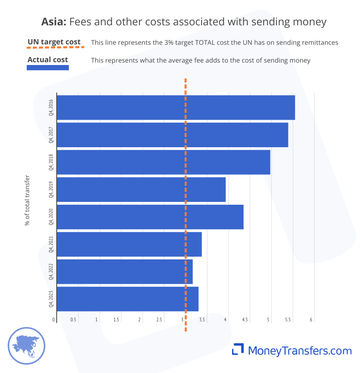
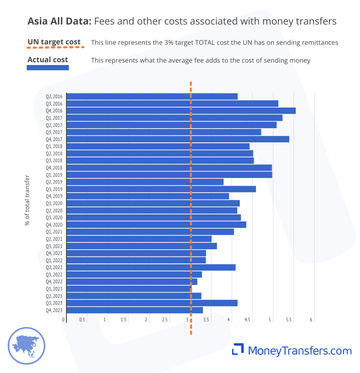
Fees and other costs
This data shows the other costs and fees associated with sending money as a percentage of the overall transfer. The data is from 2016 to date. Generally, these will be fees charged and potentially intermediary fees and receiving fees.
Since 2016, the average fee for transfers into Asia has dropped from 5.5% to 3.3% of the total transfer amount.
Average costs for remittances into Asia are more competitive through money transfer operators. For example, in Q3 2023, banks had average fees of 8.45%, compared to money transfer companies with fees of 2.85%.
This graph shows the average fee as a percentage of the total transfer amount for sending money to Asia.
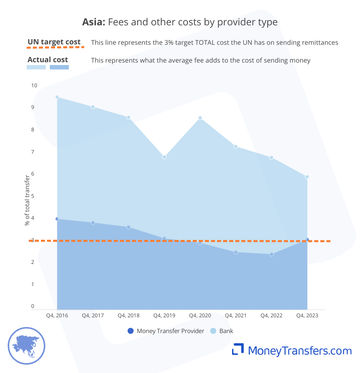
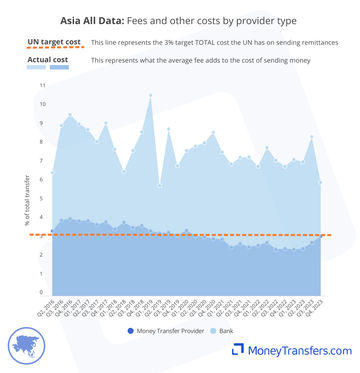
Fees and other costs by company type
The graphs here show the average fee for sending money to Asia by the type of provider.
This graph shows the average cost by provider type for transfers into Asia.
How exchange rate markup and fees make up the total cost
The data in this section highlights how the average markup and fee amounts impact the total cost of sending money into Asia.
The average cost for sending money to Asia has never been below 5%.
Money transfer companies have historically offered lower overall costs. Banks have historically been the most expensive option.
Exchange rate and fees by type of company
Within this, we have covered various types of companies, including hybrid companies, post offices, and banks.
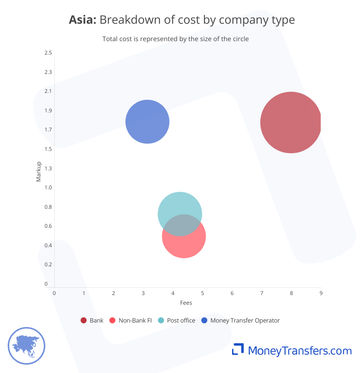
Data for the type of company
Type | Fees | FX Markup | Total Cost |
|---|---|---|---|
Bank | 7.99% | 1.78% | 9.77% |
Non-Bank FI | 4.37% | 0.55% | 4.92% |
Post office | 4.24% | 0.79% | 5.03% |
Money Transfer Operator | 3.14% | 1.79% | 4.93% |
Our data
This data has been compiled from the following sources:
WorldBank and UN data on access to remittance and the cost of remittances through different provider types.
Live data from our own comparison engine.
All data has been edited and fact checked by our team.
Explore remittance statistics
Our remittance data center is always growing.
We often cover new topics and will regularly update reports as new data emerges.
Wise Transfer Fees
Here's a quick summary of Wise transfer fees and our findings.


Global Data: Remittance Data and Statistics
The data on this page is compiled from various sources and highlights the changing remittance payment landscape. The UN has a target cost for all remittances to be below 3% of the transfer amount. We have shown this amount on the graphs throughout.

.svg)
South America: Remittance Data and Statistics
The data and graphs below highlight the average cost of sending a $200 transfer to South America. This data includes money transfer companies, banks, post offices, and other financial institutions.The average 3% target set by the UN is also presented in the graphs.

Europe: Remittance Data and Statistics
This graph shows the average cost of sending money into Europe from 2016 to date and is based on a $200 transfer. This includes countries that support EUR to EUR transfers as well. We have included these to highlight the impact of unreasonably high fees on the overall cost of sending money.

North America: Remittance Data and Statistics
The data below shows the average cost of sending $200 to North America as a percentage of the amount sent.

Data Center

Africa: Remittance Data and Statistics
This graph shows the average cost of sending money from 2016 to date and is based on a $200 transfer to Africa. The cost is a combination of fees and exchange rates.
Contributors

Keith Hodges

Please share your experience with …