We only list companies that are trustworthy and appropriately licensed. Our aim is to give you a comprehensive view of the regulated money transfer marketplace.
We only list companies that are trustworthy and appropriately licensed. Our aim is to give you a comprehensive view of the regulated money transfer marketplace.
|Disclosure
MoneyTransfers aims to help users find the best money transfer provider for their needs. To support our free service, we may earn a commission from some of the providers listed in our search results. The commission may also impact the ordering of the providers shown. Our reviews are independent from this and are based on our editorial policy, research and testing of dozens of remittance providers on the market.
MoneyTransfers aims to help users find the best money transfer provider for their needs. To support our free service, we may earn a commission from some of the providers listed in our search results. The commission may also impact the ordering of the providers shown. Our reviews are independent from this and are based on our editorial policy, research and testing of dozens of remittance providers on the market.
Table of Contents
If you're planning to send money to India from the U.S., the exchange rate between the Indian Rupee (INR) and the U.S. Dollar (USD) is an important factor.
Here's a simple breakdown of where things stand right now, what might happen next, and how it could affect your transfers in the coming weeks.
USD/INR is currently trading at 95.215504.
Search Now & Save On Your Transfer
Instantly view live exchange rates, fees & features.
What is likely to happen to USD/INR in July 2026
USD to INR is likely to stay volatile next month, with a probable range of 89 to 91, and a real chance of spikes toward 91.5 to 92. RBI may limit extreme moves, but underlying pressure on INR from flows and dollar demand still matters.
For most senders, the most sensible plan is to split transfers over time rather than betting everything on one rate.
USD to INR: Where It Stands
Right now, USD to INR is trading around a historic zone after the rupee weakened past 90 per US dollar in December 2025. Since May, the rupee has fallen sharply, but it has also shown quick rebounds when the Reserve Bank of India (RBI) steps in.
For the next month, the most likely outcome is a choppy, back and forth market around 89 to 91, with sudden spikes possible.
What’s Driving USD to INR?
A few big things are pushing this pair around, and they matter more than day to day “news noise.”
1) Dollar demand is high in India: Importers, overseas payments, loan repayments, and outward remittances create steady buying of US dollars. This keeps pressure on the rupee even when it briefly improves.
2) Foreign investor money has been leaving India: Foreign portfolio investors have been pulling money out of Indian equities, which reduces demand for INR and supports a higher USD to INR rate.
3) Trade deficit and gold and oil effects: A wider trade deficit means India needs more dollars to pay for imports. If crude oil prices rise, that typically weakens INR because India imports a lot of oil.
4) RBI is smoothing the ride: The RBI has shown it will act to reduce extreme moves, especially near big psychological levels like 90 and 91. That usually creates sharp pullbacks, but not always a long lasting reversal.
What Do the Charts Say?
This market is treating 90 as the main “battle line.” When USD to INR holds above 90, the bias stays slightly in favor of a stronger dollar.
Key levels to know:
Level
Why it matters
What it could mean
89.45 to 89.85
Key support zone
Below this, INR recovery could extend
90.00
Psychological pivot
Above it, USD stays supported
91.25
Major resistance
Break above can pull in momentum buying
91.50 to 92.00
Next upside zone
Possible spike area if pressure returns
Most signs point to range trading with an upside tilt unless USD to INR falls and stays below roughly 89.5.
What to Watch in the Next Month
These are the things most likely to move your exchange rate.
RBI intervention signals: sudden drops from 91 toward 90 can happen quickly if RBI sells dollars.
US inflation and Fed rate expectations: a stronger US data print can lift the dollar broadly, pushing USD to INR higher.
Oil prices: higher oil usually hurts INR.
Foreign investor flows: if outflows slow or reverse, INR can stabilize or strengthen.
Risks Ahead
The biggest risk is sudden volatility around round numbers:
Upside risk (USD to INR goes higher):If foreign outflows continue, oil rises, or US data boosts the dollar, USD to INR could test 91.5 to 92.
Downside risk (USD to INR drops):If RBI support becomes more aggressive or global dollar strength fades, USD to INR could slip toward 89.5, and if that breaks, toward 88.5.
What This Means If You’re Sending USD to INR Abroad
If you are converting USD to INR, a higher USD to INR rate means you get more rupees for each dollar.
Given the expected choppiness, trying to pick the perfect day is risky. A simple, practical approach many people use is staggering:
Convert 50 to 60 percent now (locking in today’s high-ish levels near 90).
Convert the rest in 2 to 4 smaller transfers over the next month.
This helps if the rupee suddenly strengthens after RBI action, and it also helps if USD to INR spikes higher later.
The US and India are among the biggest economies in the world in terms of GDP.
The US has a combined GDP of over $23 trillion while India recently overtook the UK to become the fifth biggest economy in the world after the US, China, Japan, and Germany.
The USD to INR is therefore an important currency cross because of the vast volume of trade that happens between the two countries.
This volume started growing in the 1990s when India started to reopen its economy.
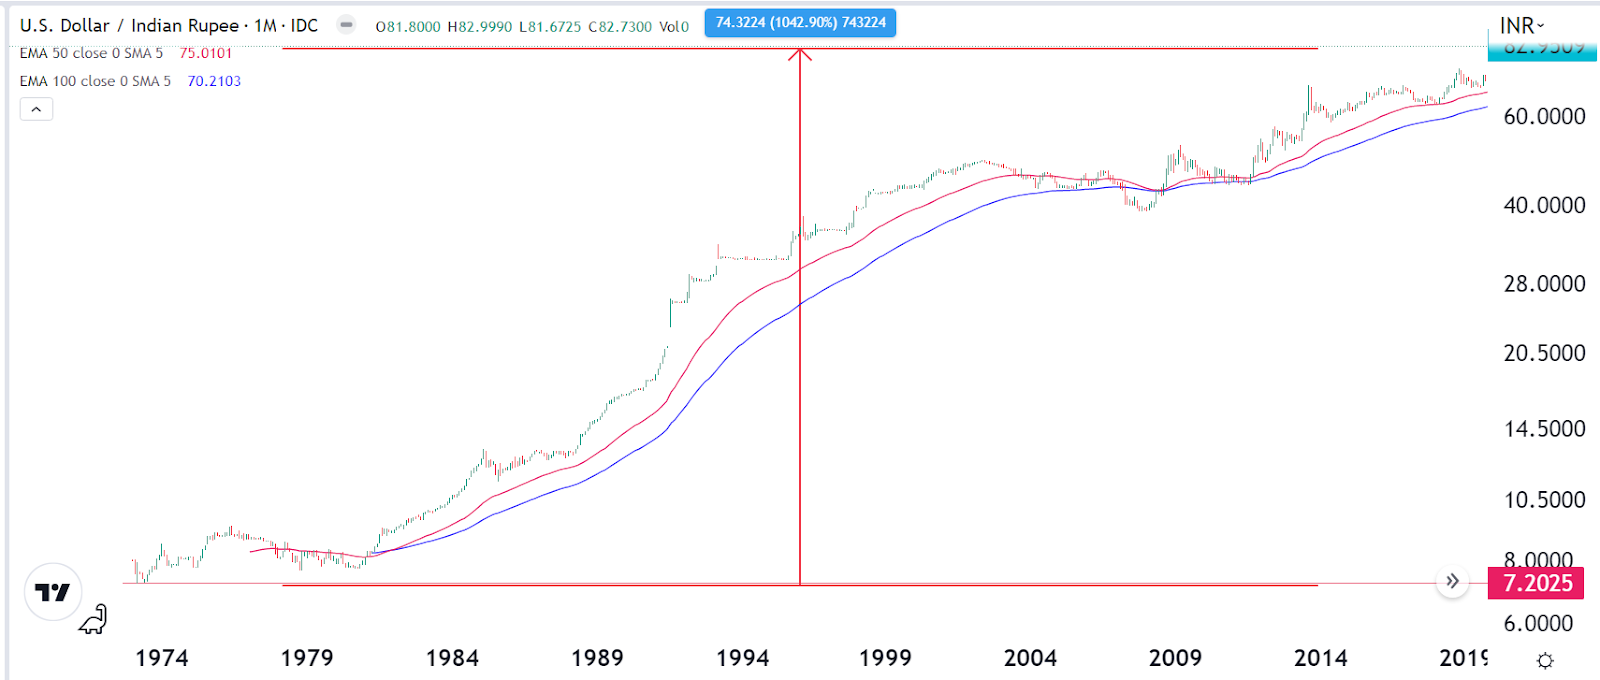
While India’s economy has been growing, its currency has been in a downward trend over the years.
Today, it is trading at about 82 against the US Dollar.
The Indian rupee has dropped by 28% in the past five years against the U.S. dollar.
It has also dropped by about 9% in the past 12 months even after the Federal Reserve and the Reserve Bank of India (RBI) have embraced an extremely hawkish tone.
The USD/INR pair is often influenced by a number of factors, including the actions of the Fed and RBI, economic numbers between the two countries, and global macro factors.
It is also affected by the overall trade volume between the US and India, which averages over $146 billion per year.
Date
1 US Dollar in INR
Jun 26, 2026
94.325040 INR
Jun 27, 2026
94.360504 INR
Jun 28, 2026
94.360550 INR
Jun 29, 2026
94.790750 INR
Jun 30, 2026
94.918250 INR
Jul 01, 2026
95.417750 INR
Jul 02, 2026
95.527350 INR
Jul 03, 2026
95.522150 INR
Jul 04, 2026
95.215504 INR
Jul 05, 2026
95.215504 INR
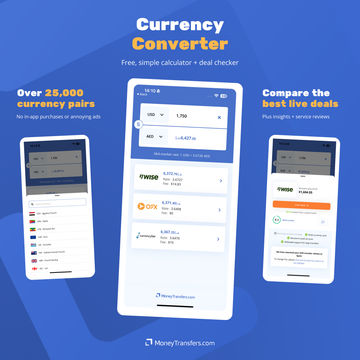
MoneyTransfers App
Convert and compare on the go with our converter app
Our handy, modern currency app lets you:
Instantly convert 25,000+ currency pairs
Compare live transfer deals
Get reviews & insights
Our app is free for mobiles and tablets, with no intrusive ads or in-app purchases.
Crispus Nyaga is a distinguished financial analyst with over nine years of industry experience, specializing in the stock market, forex, equities, and commodities. His insightful analysis has been featured by prominent financial brands, showcasing his deep understanding of market dynamics. As an active trader managing his family's investments, Crispus combines practical trading acumen with analytical expertise.
With 6+ years of hands-on experience in international money transfer services, Artiom has tested and analyzed dozens of companies, services, and apps firsthand. From sending money between the UK, EU, US, JP, and ID, to helping friends and family transfer large amounts abroad, he combines deep personal experience with industry insight.
He has worked on content and product at MoneyTransfers.com since 2019, with a focus on FX rates, transfer apps & companies, and comparison tools. His work has been featured in Forbes, Yahoo Finance, Decrypt, PoundSterling, and more.
Search Now & Save On Your Transfer
Instantly view live exchange rates, fees & features.


.svg)


Please share your experience with …